Next: 3.3.3 Finding common alterations
Up: 3.3 Data analysis
Previous: 3.3.1 Manual analysis
Contents
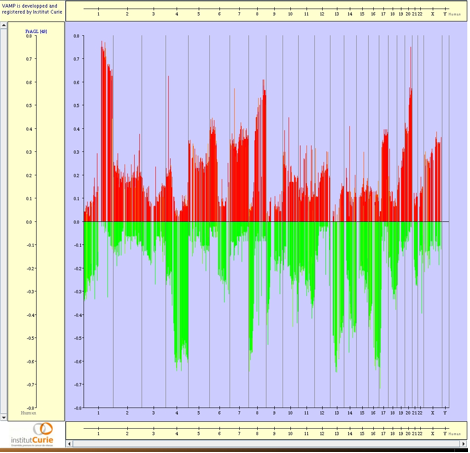
The identification of systemic alterations within a set of tumors is central to the analysis of CGH array data for two reasons. Firstly, it can pinpoint new candidate genes, as tumor suppressor genes and oncogenes are thought to be present in regions of loss and gain, respectively. Secondly, some alterations may be significantly correlated with clinical phenotype and may therefore be useful for diagnosis and prognosis. The simplest way to identify informative regions is to work at the probe level. For each probe, the fraction of tumors with gains and losses over the dataset is computed (see Figures 3.34) and displayed in the FrAGL view (see Figures 3.36).
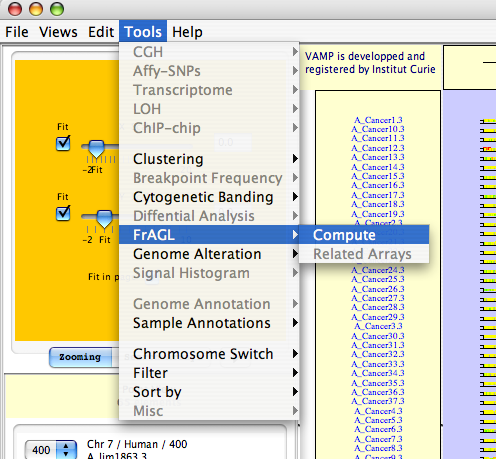
Figure 3.34:
Tools  FrAGL Compute - Open dialog the FrAGL dialog box.
|
|
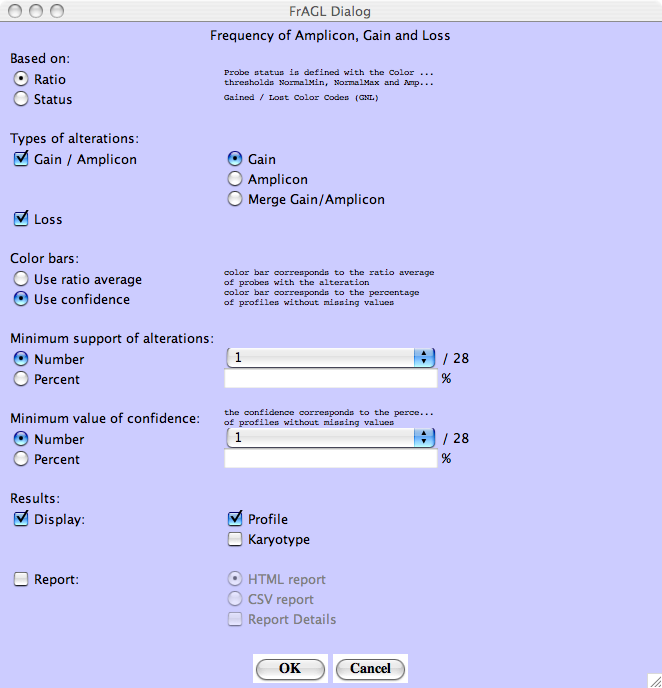
Once the FrAGL dialog box is opened (see Figures 3.35) different options are available:
- Based on Ratio:
- Probe status is defined with the Color Legend thresholds NormalMin, NormalMax and Amplicon (see Figures 3.24)
- Based on Status:
- Probe status is defined with Gained / Lost Color Codes (GNL)
- Type of alterations:
- For gain region the user can search for either only Gain, either only Amplicon or merge Gain and Amplicon
- Color bars ratio average:
- Color bar corresponds to the ratio average of probes with the alteration
- Color bars confidences:
- Color bar corresponds to the percentage of profiles without missing values
- Minimum support of alterations:
- Probe with a frequency less than this number are discarded
- Minimum value of confidence:
- The confidence corresponds to the percentage of profiles without missing values. Probe with a frequency which have been computed with less than this number are discarded
- Results:
- The frequency is displayed in a profile view (see Figures 3.36) or in a Karyotype classical view (see Figures 3.13)
- Report:
- The frequency are saved in a HTML or CSV file
Figure 3.35:
FrAGL dialog - Different FrAGL options are available.
|
|
Figure 3.36:
FraGL profiles - FrAGL (Frequency of Amplicon, Gain and Loss) view. The values correspond to the percentage of gained and lost clones identified with GLAD over the whole dataset from Patil et al. (2005)
|
|
Next: 3.3.3 Finding common alterations
Up: 3.3 Data analysis
Previous: 3.3.1 Manual analysis
Contents
2007 - Institut Curie Bioinformatics unit