Next: 3.2.4.3 X and Y
Up: 3.2.4 Visual rendering
Previous: 3.2.4.1 Zoom
Contents
3.2.4.2 Color codes
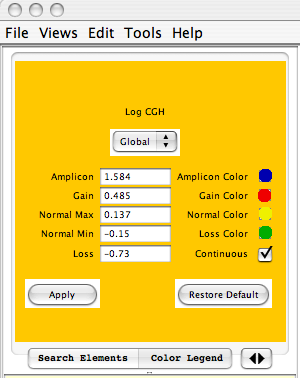
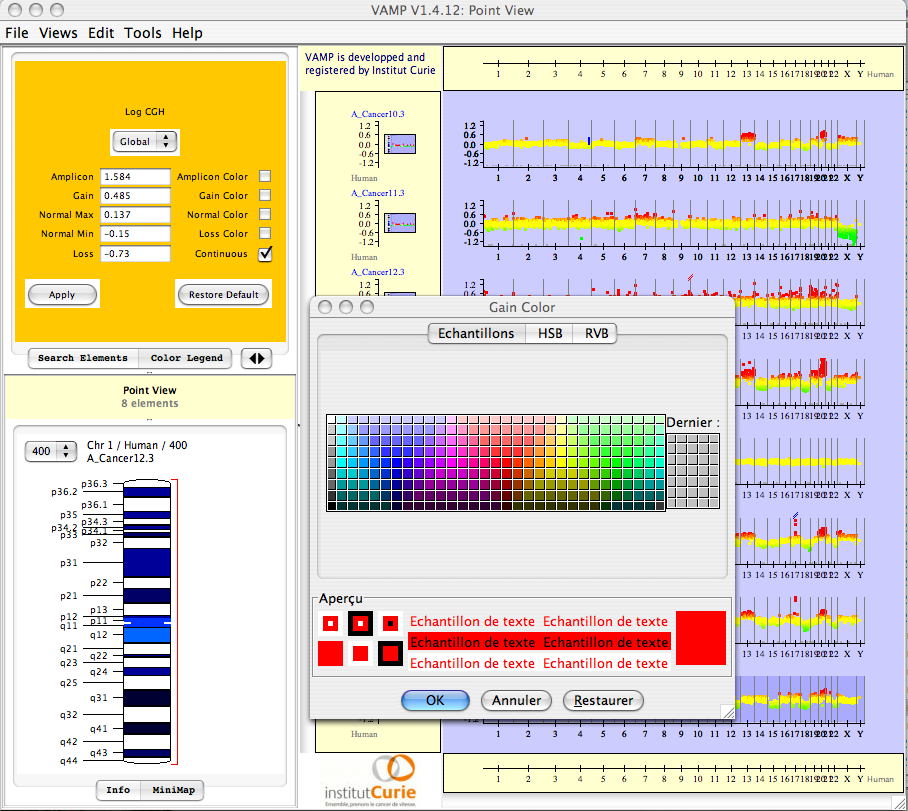
By default, points or barplots are colored according to the signal intensity (generally using ratios of the two channels or log-ratios) using a continuous scale from red to yellow to green. The user can easily change the thresholds and colors of the clone ratios, either for one particular array (Local option) or for all arrays displayed (Global option) (see Figure 3.24 and 3.25).
Figure 3.24:
Color Legend Panel.
|
|
Figure 3.25:
Color Legend Panel.
|
|
For each of the views described in section 3.2.2, molecular profiles can be colored according to the results of array-CGH data analysis (see section 3.2.2).
2007 - Institut Curie Bioinformatics unit