Next: 3.3.2 FrAGL (Frequency of
Up: 3.3 Data analysis
Previous: 3.3 Data analysis
Contents
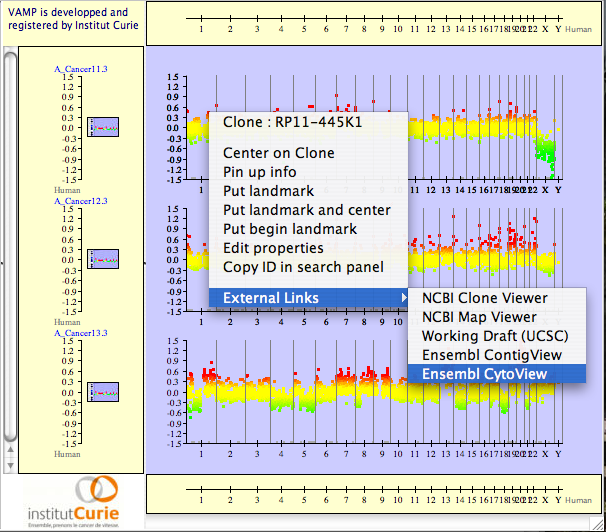
Among the numerous functions of VAMP, the user has the possibility to put his own marks and regions. This is done by right-clicking on clone/probe element under the mouse pointer of any molecular profile. A menu appears as shown in Figure 3.32 allowing various actions to be performed:
Figure 3.32:
Contextual Menu - The user can easily put landmarks and regions of biological interest.
|
|
Within the contextual menu, it is possible:
- Center on Clone/Probe:
- to center the profile around the current position.
- Put landmark:
- to draw a vertical bar trough all the profiles to define a locus.
- Put begin landmark, Put end landmark:
- to draw a region over the set of profiles.
- External links:
- to retrieve any information from public or local databases.It is possible to add your favorite database (see section 2.2.3).
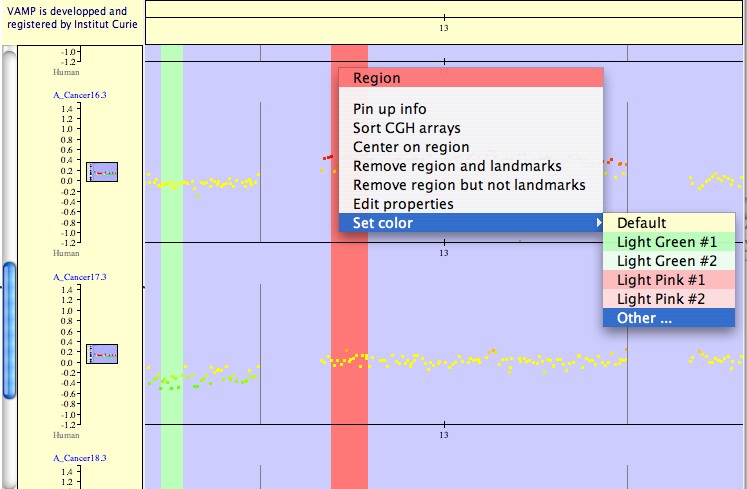
The user can customize colors by right-clicking onto landmarks and regions and then using Set colors for a better visualization (see Figure 3.33).
Figure 3.33:
Customize Analysis - Choose your favorite color.
|
|
Next: 3.3.2 FrAGL (Frequency of
Up: 3.3 Data analysis
Previous: 3.3 Data analysis
Contents
2007 - Institut Curie Bioinformatics unit