Next: 3.3.10 Differential Analysis
Up: 3.3 Data analysis
Previous: 3.3.8 Confrontation with Genome
Contents
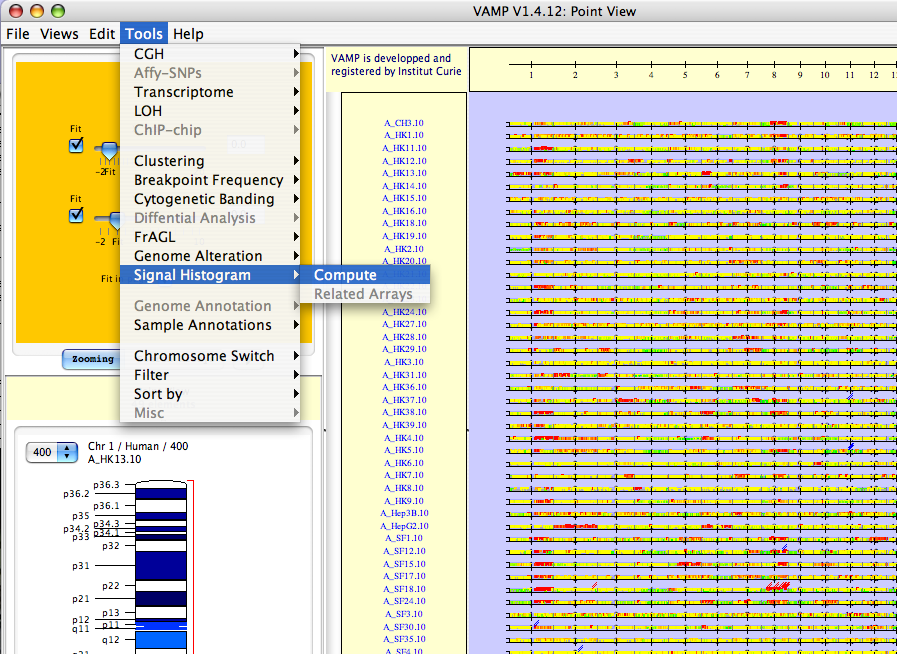
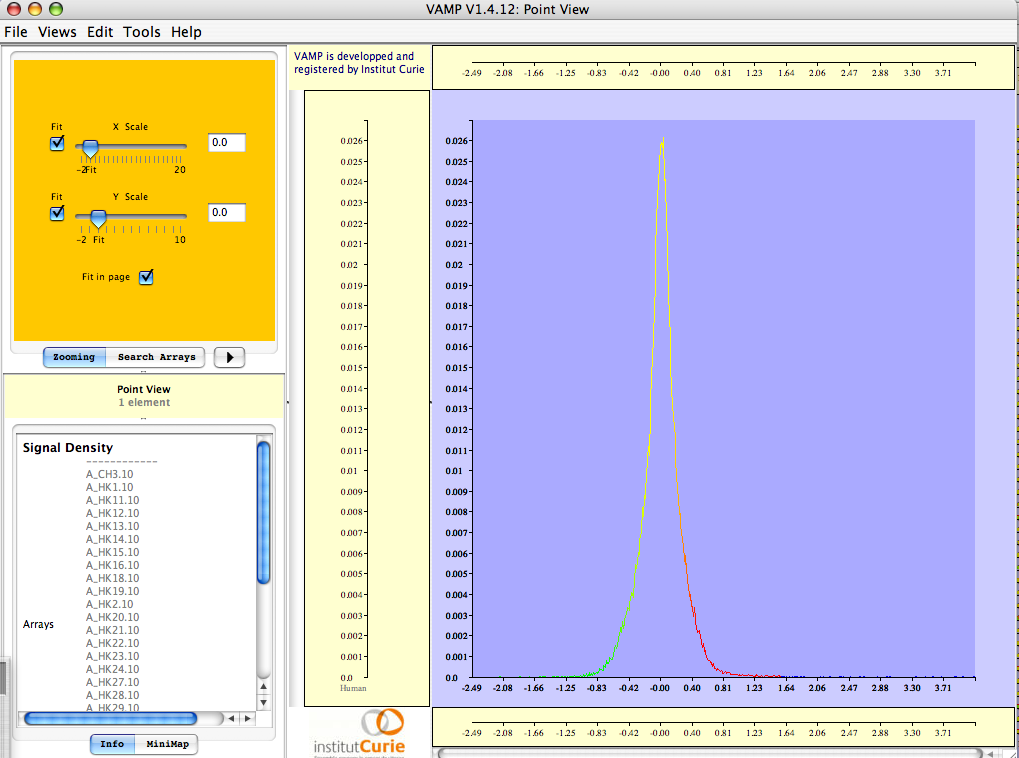
The Histogram of the signal can be computed over the profiles which are displayed in the current view (see Figures 3.59 and 3.60).
Figure 3.59:
Tools  Signal Histogram Compute - The user can open a new window of display signal histogram view.
|
|
Figure 3.60:
Signal Histogram profiles - Signal Histogram profiles view. The values correspond to the ... over the whole dataset from Patil et al. (2005).
|
|
2007 - Institut Curie Bioinformatics unit