Next: 3.3.9 Signal Histogram
Up: 3.3 Data analysis
Previous: 3.3.7 Synteny analysis
Contents
With VAMP it is possible to compare a molecular profile with genome annotations, for example gene structure: the user can load a pseudo-profile with the structure of all known genes (introns, exons, splicing variants). Several functions are offered. Proceed as follows:
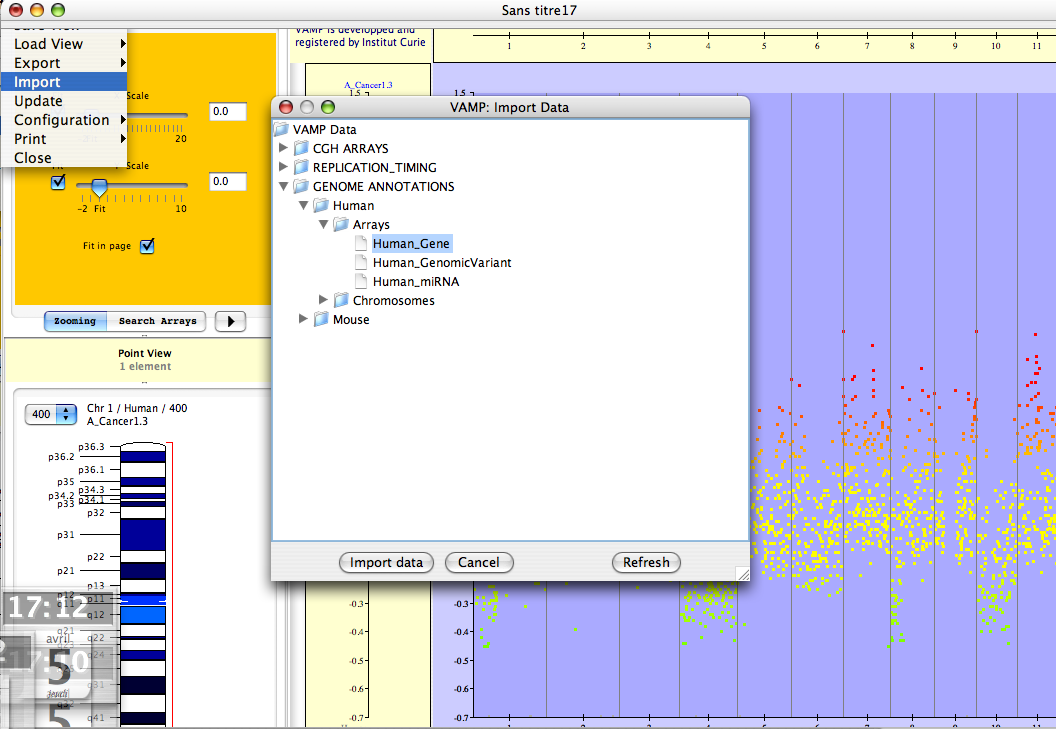
- import the genome annotation data (see Figures 3.55)
- put a landmark on your favorite gene and center on it (see Figures 3.56)
Figure 3.55:
File  Import - Start by importing genome annotation data.
|
|
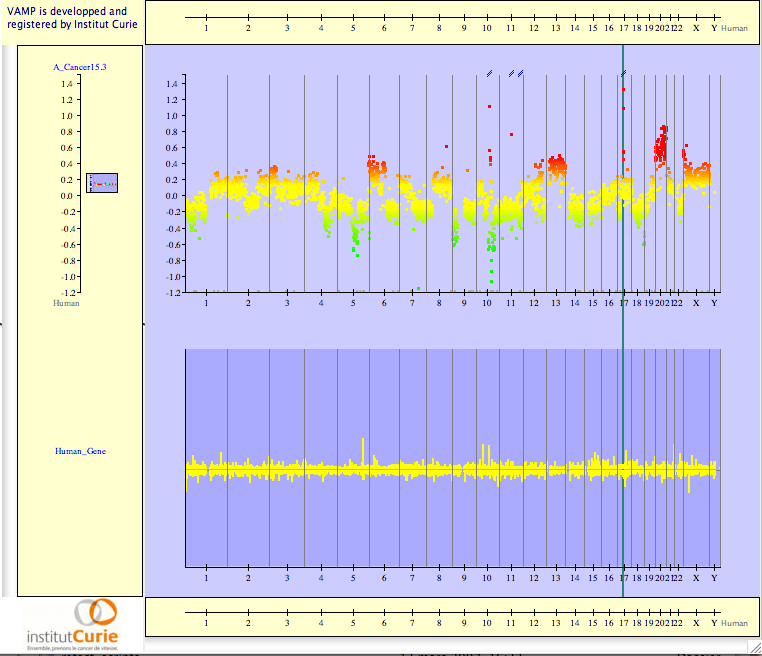
Figure 3.56:
Genome Annotation - Then you can put a landmark on your favorite gene and center on it.
|
|
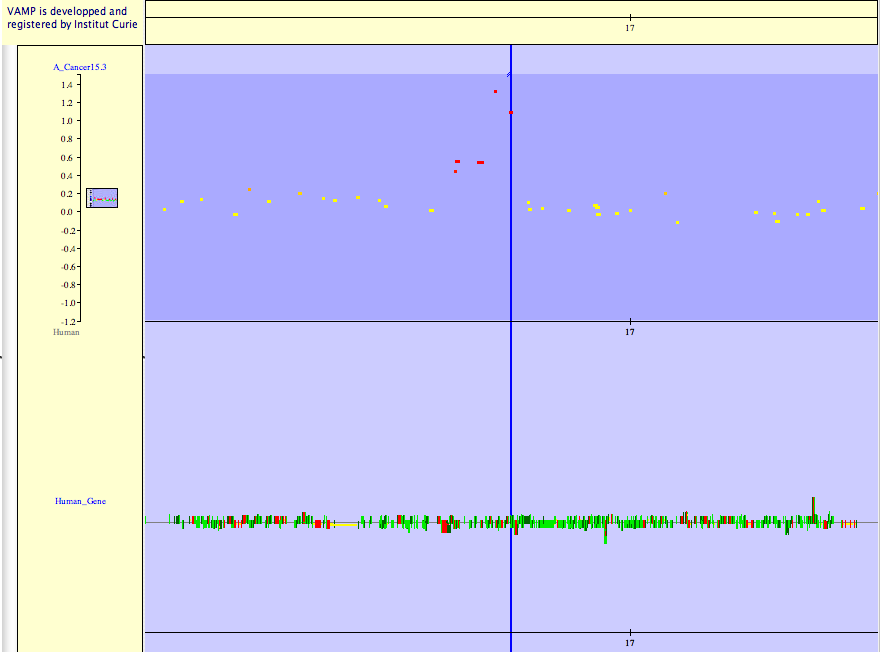
Then you can zoom on the landmark until the gene structure is visible (see Figures 3.57).
Figure 3.57:
Genome Annotation (zoom 3x)
|
|
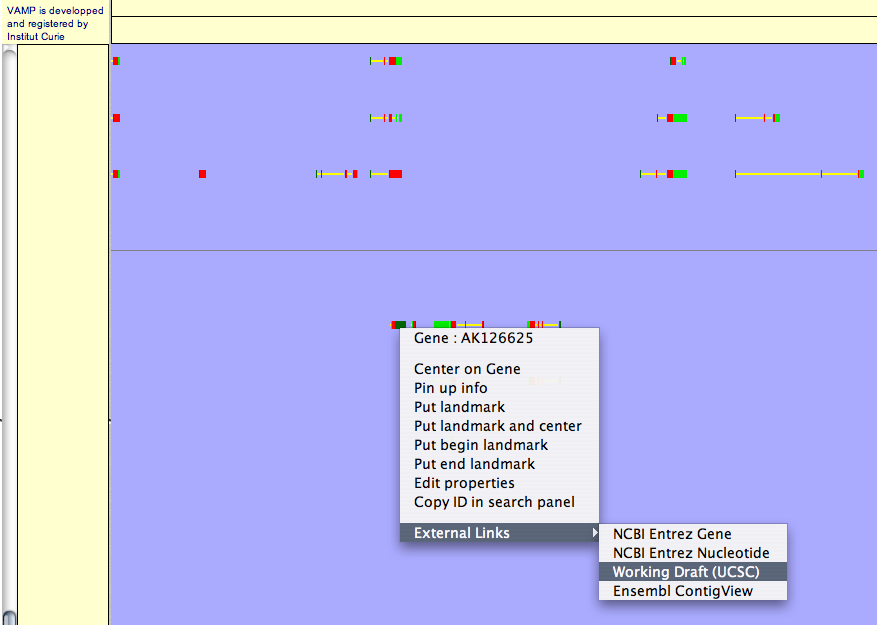
Right-clicking brings up a menu which allows to open web pages from NCBI gene, UCSC Genome Browser or Ensembl ContigView (see Figures 3.58).
Figure 3.58:
Genome Annotation (zoom 30x) (exons in red, introns in yellow, UTR 3' in light green and UTR 5' in dark green)
|
|
Next: 3.3.9 Signal Histogram
Up: 3.3 Data analysis
Previous: 3.3.7 Synteny analysis
Contents
2007 - Institut Curie Bioinformatics unit