Next: 3.3.11 Correlation Analysis
Up: 3.3 Data analysis
Previous: 3.3.9 Signal Histogram
Contents
The aim of the differential analysis is to compare the signal value of each probe between two user-defined groups of tumors. The user has to perform the following steps:
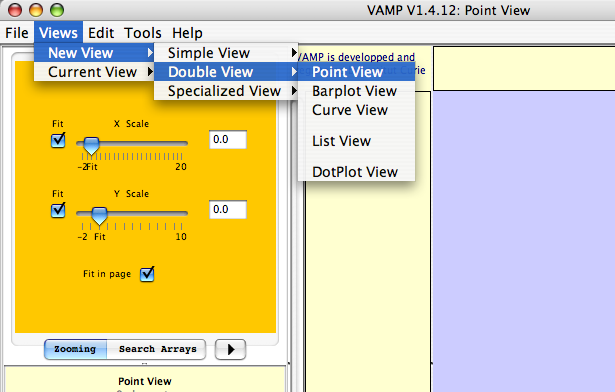
- First the user must open a new double window (see Figure 3.61)
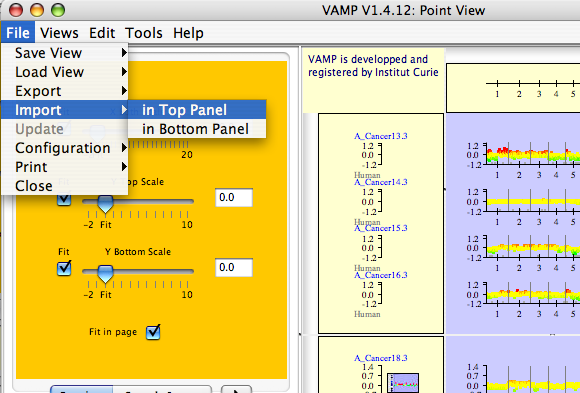
- Then the user load in the top panel the tumors defining the first group (see Figure 3.62)
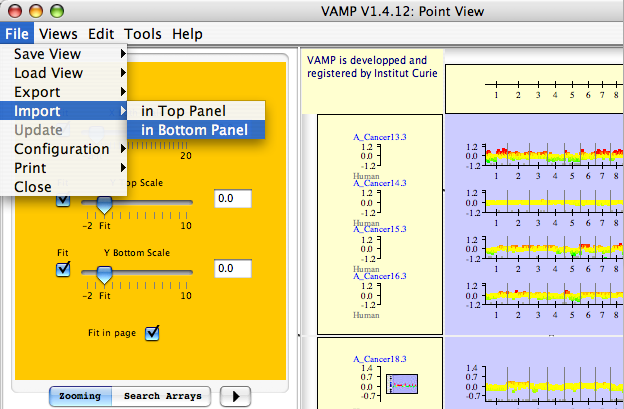
- The tumors defining the second group are loaded the bottom panel (see Figure 3.63)
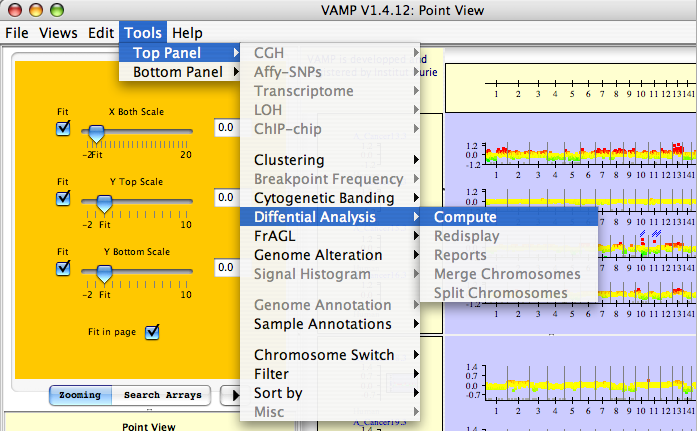
- Launch the analysis (see Figure 3.64)
Figure 3.61:
Views  New View Double View Point View - First the user must open a new double window.
|
|
Figure 3.62:
File Import in Top Panel - Then the user must loading several profiles in the top panel.
|
|
Figure 3.63:
File Import in Bottom Panel - Then the user must loading several profiles in the bottom panel.
|
|
Figure 3.64:
Tools Top Panel Differential Analysis Compute - The user can open a new window of dialog for Differential Analysis.
|
|
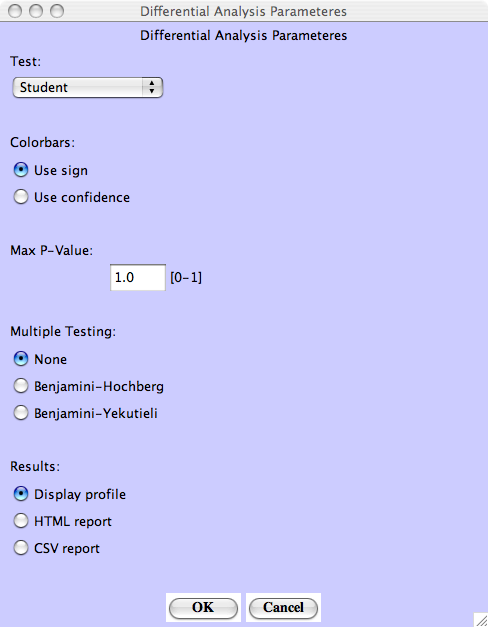
Different options are available within the Differential Analysis dialog box:
- Test:
- Statistical test is performed using either Student or Welch test.
- Color bars Use sign:
- If the probe mean of the group in the bottom panel is greater than the probe mean of the group in the top panel, the bar is displayed in red and otherwise in green
- Color bars Use confidence:
- Color bar corresponds to the percentage of profiles without missing values
- Max P-Value:
- Probes with a p-value greater than this value are discarded
- Multiple testing Benjamini-Hochberg:
- ajusted p-values using Benjamini-Hochberg method
- Multiple testing Benjamini-Yekutieli:
- ajusted p-values using Benjamini-Yekutieli method
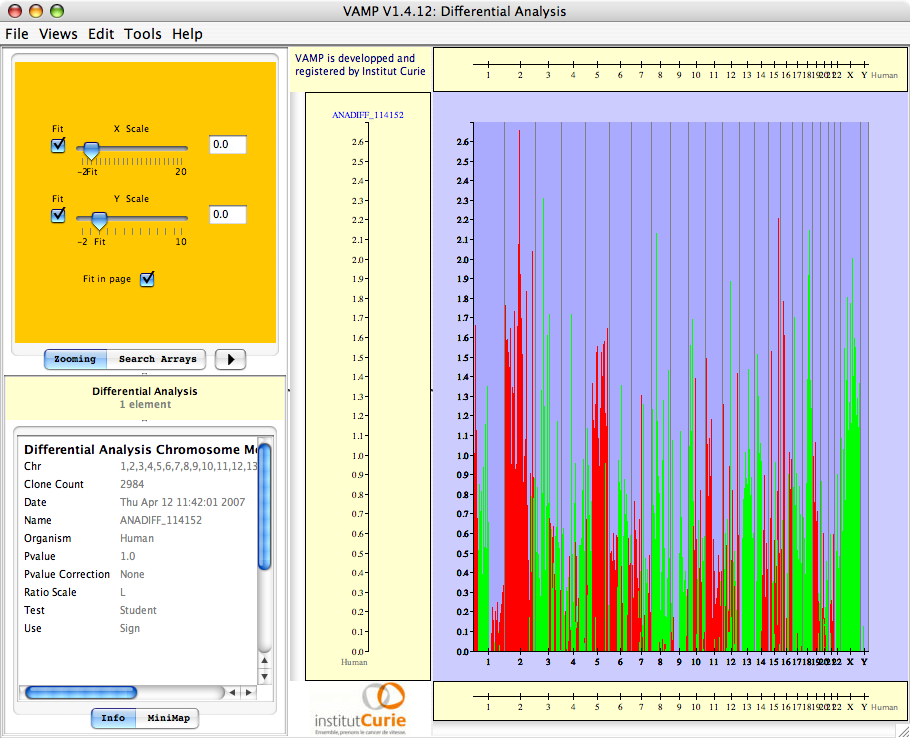
- Results:
- The results are displayed in a profile view (see Figure 3.66). The values correspond to
 p-value
- Report:
- The results are saved in HTML or CSV file
Figure 3.65:
Differential Analysis dialog - Different options are available.
|
|
Figure 3.66:
Differential Analysis profiles - Differential Analysis view.
|
|
Next: 3.3.11 Correlation Analysis
Up: 3.3 Data analysis
Previous: 3.3.9 Signal Histogram
Contents
2007 - Institut Curie Bioinformatics unit