Next: 3.3.8 Confrontation with Genome
Up: 3.3 Data analysis
Previous: 3.3.6 Confrontation with sample
Contents
VAMP can display the syntenic projection of a profile onto the genome of another species, which serves as a reference; a typical application is the projection of a mouse array-CGH profile onto the human genome (Figure 3.54). In such a case, the mouse clones are ordered according to their mapping onto the human genome. VAMP uses pre-computed information mapping each clone of the sample array onto the reference genome. The synteny relationships can be shown, for a selection of regions of the genome, as links from each clone of the profile to the location of the most similar sequence of the reference genome. To perform the syntenic projection over the whole genome or on genomic regions do as described in Figures 3.51 and 3.52.
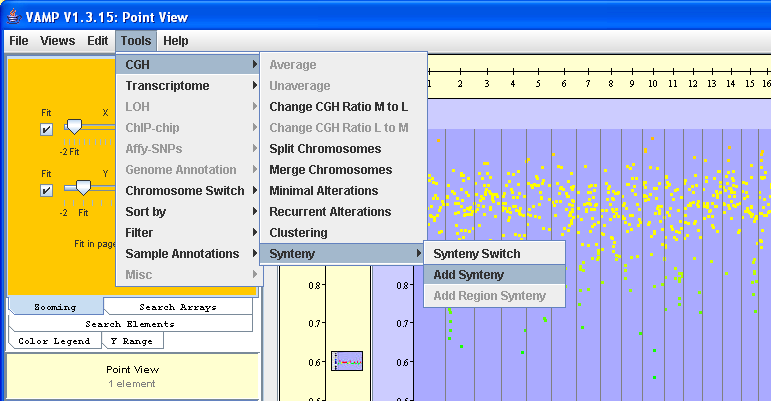
Figure 3.51:
Switch or Add - The user can replace a profile by its projection onto another species genome by using Synteny  Switch or he can add the projection below the original profile in the same window by using Synteny Add.
|
|
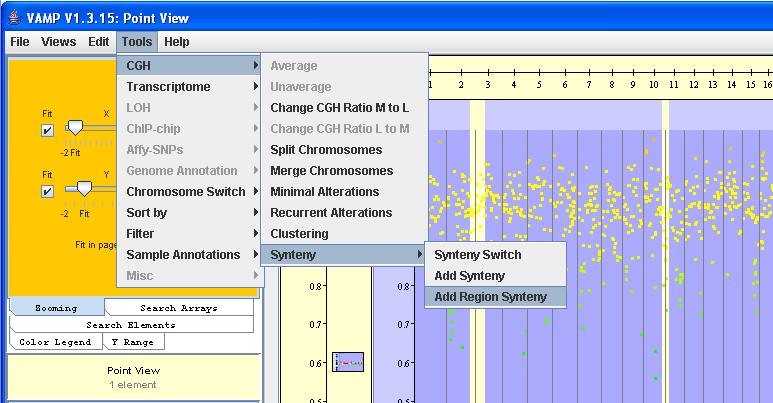
Figure 3.52:
Add Region Synteny - The user can projects only those clones that are comprised in the regions he has defined by using Synteny Add Region Synteny. Results are shown in the next figure.
|
|
In order to see the links of the syntenic projection perform as described in Figures 3.53 and 3.54.
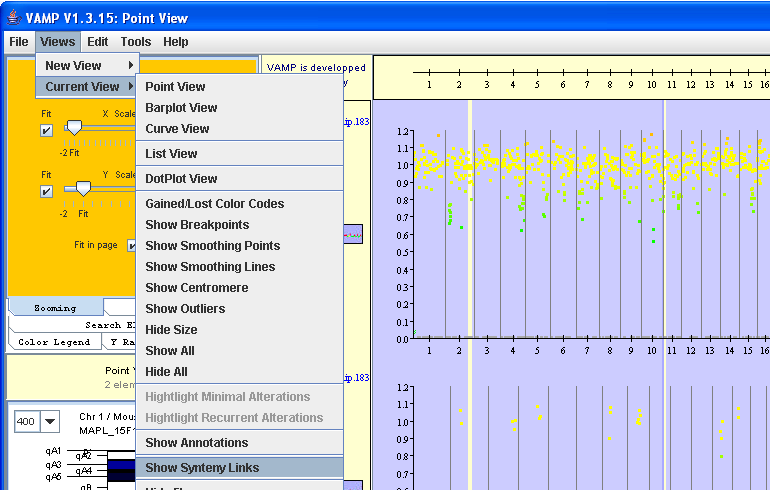
Figure 3.53:
Show Synteny Links - The user can visualize the links of synteny using Current View Show Synteny Links. Results are shown in the next figure.
|
|
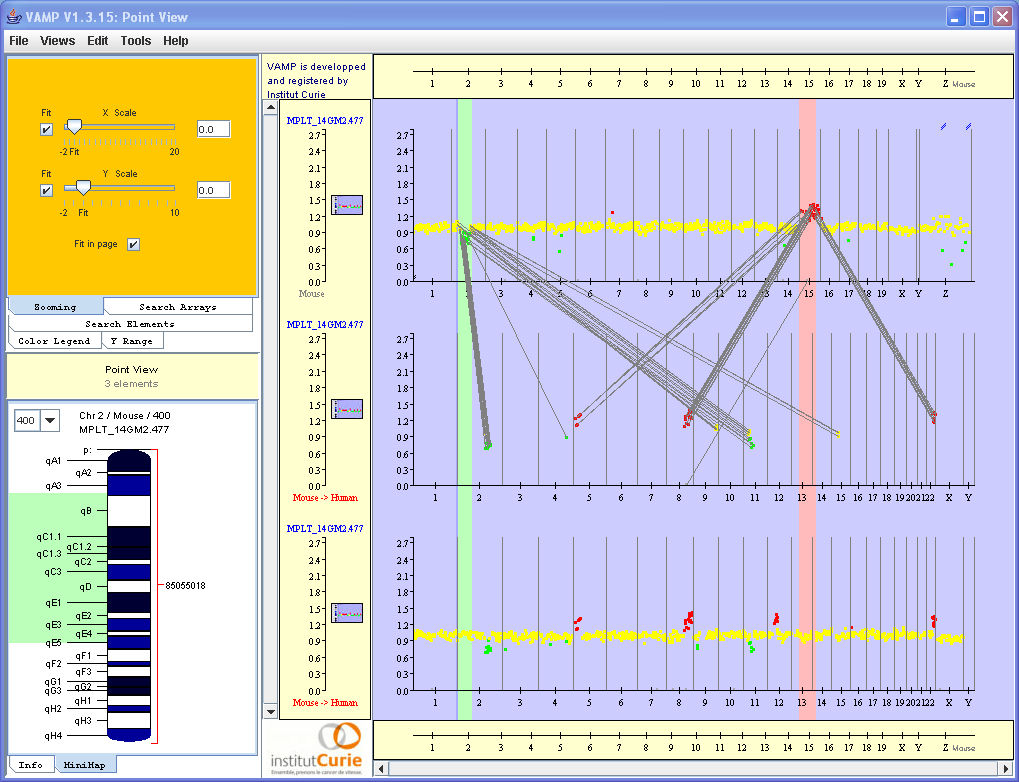
Figure 3.54:
Synteny visualization - A complete example of visualization of synteny. The original mouse profile is on the top, its projection onto the human genome at the bottom, and the projection of the clones from the two highlighted regions in the middle, with links from the mouse-ordered profile to the human projection.
|
|
Next: 3.3.8 Confrontation with Genome
Up: 3.3 Data analysis
Previous: 3.3.6 Confrontation with sample
Contents
2007 - Institut Curie Bioinformatics unit