Next: 3.3.7 Synteny analysis
Up: 3.3 Data analysis
Previous: 3.3.5 Comparing profiles
Contents
3.3.6 Confrontation with sample annotation
Clinical data, or any other sample annotations present in the additional XML files (see section 2.2.4) can be visualized in the interface or used for filtering tumors or for sorting them (the link between additional data and molecular profile is based on the XML tag <NumHisto> representing a unique patient ID (see section 2.2.4). To add any clinical properties in the current view, just do the following:
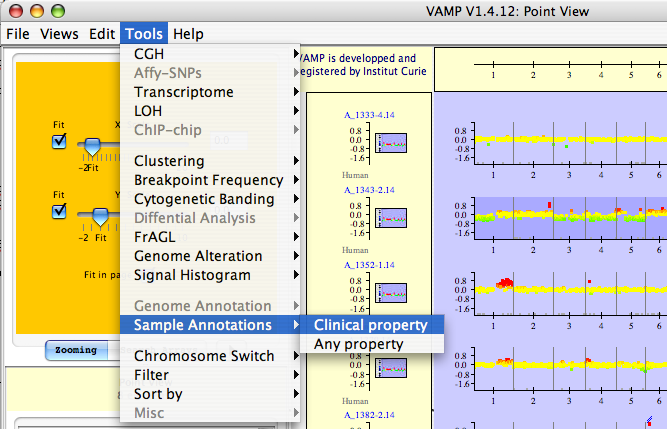
- open the dialog to add clinical properties (see Figures 3.48)
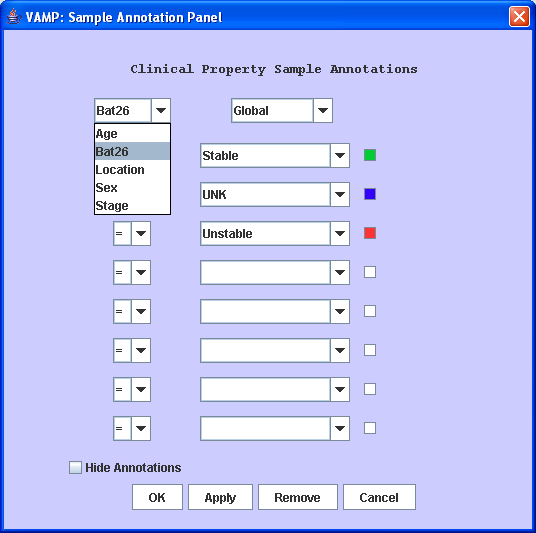
- choose the properties you want to display (see Figures 3.49)
Figure 3.48:
Tools  Sample Annotations Clinical property - The user opens a dialog box where he can easily choose the available clinical properties.
|
|
Figure 3.49:
Sample annotations - The user chooses clinical properties to be visualized.
|
|
This data can be visualized as color-coded bars in an annotation frame on the left of the profiles, and can be easily compared with a clustering result (Figure 3.50).
Figure 3.50:
VAMP interface - Dotplot view of array-CGH profiles (middle panel), and dendrogram resulting from a hierarchical clustering (right panel). In between, color-coded clinical information about the samples, with a legend (bottom left). Data from Nakao et al. (2004)
|
|
Next: 3.3.7 Synteny analysis
Up: 3.3 Data analysis
Previous: 3.3.5 Comparing profiles
Contents
2007 - Institut Curie Bioinformatics unit