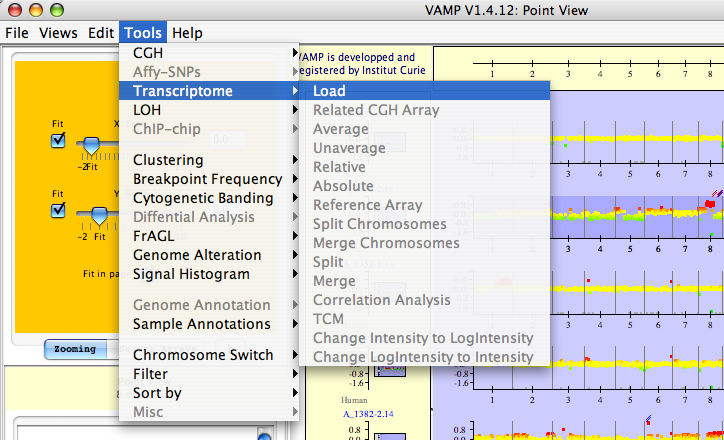
VAMP proposes several data manipulation procedures for the profiles such as loading any type of profile (CGH, expression, LOH, ChIP chip) for a given sample. A typical application of VAMP is the simultaneous visualization of the DNA alterations and gene under- and over-expression in a region (see Figures 3.46 and 3.47). In the case of one-color microarrays (such as Affymetrix) the user can define a reference profile and compute the ratio with a test profile: he can easily compare the ratio of gene expression with the DNA alteration.
|
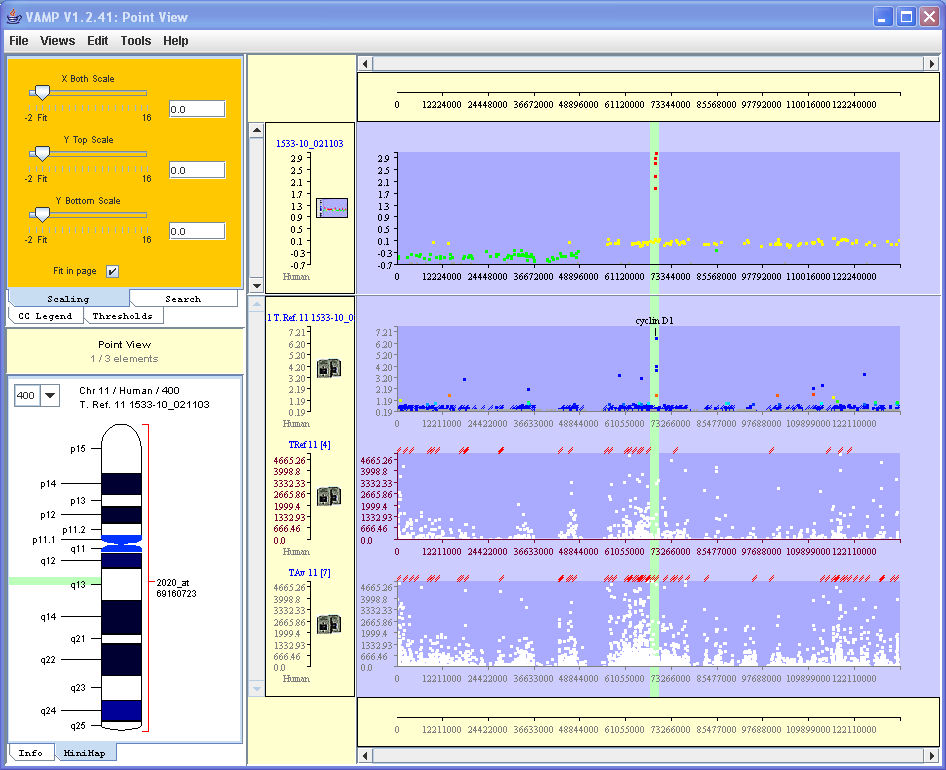
In the example below we compare array-CGH (top profile) versus transcriptome ratio (second profile in descending order), computed for Affymetrix U95 array of a bladder tumor sample and of a reference sample. This confrontation pinpoints the probable implication of the oncogene cyclin D1 in this tumor. The third and fourth profiles in descending order correspond to a reference profile (average normal bladder tissue profile) and the profile of the tumor under study, respectively. The second profile is the ratio of the fourth to the reference profile.
|