Next: 3.3.5 Comparing profiles
Up: 3.3 Data analysis
Previous: 3.3.3 Finding common alterations
Contents
3.3.4 Clustering profiles
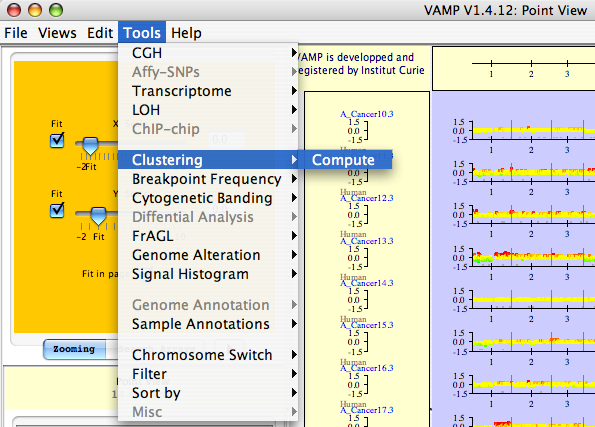
Clustering is a general technique for unsupervised data classification widely used in microarray data analysis. A VAMP function offers the possibility to perform a hierarchical clustering (Kaufman and Rousseuw, 1990) on the array CGH profiles (see Figure 3.43).
Figure 3.43:
Tools  Clustering Compute - The user can open a new window of dialog for clustering.
|
|
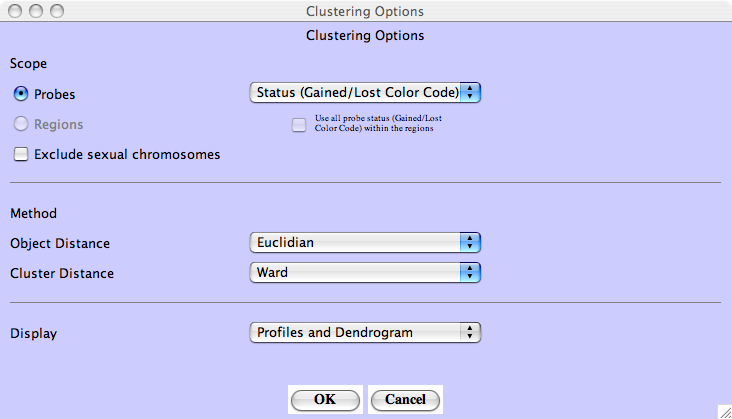
The clustering can be performed on different variables (see Figure 3.44):
- Probe LogRatio:
- The Probe LogRatio values of the whole genomic profile are used
- Probe Smoothing:
- The Probe smoothing values (i.e. the results of a segmentation algorithm) of the whole genomic profile are used
- Probe Status:
- The Probe statuses (i.e. the results of a segmentation algorithm) of the whole genomic profile are used
- Regions Status:
- Regions either selected manually or identified by our algorithm (see section 3.3.3) are used
- Exclude sexual chromosomes
- .
Different options are available:
- Distance metric:
- Euclidian, Pearson and Manhattan distance are available
- Group metric:
- Ward, Single linkage, Group Average and Complete linkage are available
VAMP displays the results as a cluster view including a heat map and the trees resulting from the clustering algorithm (Figure 3.45).
Figure 3.44:
Clustering profies - Different clustering options are available.
|
|
Figure 3.45:
VAMP interface - Dotplot view of array-CGH profiles (middle panel), and dendrogram resulting from a hierarchical clustering (right panel). In between, color-coded clinical information about the samples, with a legend (bottom left). Data from Nakao et al. (2004)
|
|
Next: 3.3.5 Comparing profiles
Up: 3.3 Data analysis
Previous: 3.3.3 Finding common alterations
Contents
2007 - Institut Curie Bioinformatics unit