next up previous contents
Next: 5. Analysis example - Up: 4. Analysis example - Previous: 4.3.4 Candidate genes   Contents


4.4 Genome/Transcriptome comparison

In the previous part, the minimal amplified regions have been identified and the gene list retrieved. In Stransky et al. (2006) transcriptome have been studied and these data can be used to identify among the gene list, the genes which show a significant correlation with respect to DNA copy number alterations . This will be detailed in what follows:

  1. open a new view: Views $\rightarrow $ New View $\rightarrow $ Simple View $\rightarrow $ Point View
  2. import all the chromosome 6 profiles from the stransky_2006 directory: File $\rightarrow $ Import (see Figure 4.4 below)
  3. once imported, select all profiles (Edit $\rightarrow $ Select $\rightarrow $ All)
  4. load transcriptome profiles associated to the CGH arrays (Tools$\rightarrow $ Transcriptome $\rightarrow $ Load)
  5. start the genome/transcriptome correlation analysis (Tools $\rightarrow $ Correlation Analysis $\rightarrow $ Compute) with default parameters

Figure 4.10: Importing array-CGH profiles
Image gtca-cgh-import-stransky

A new window opens where correlations are displayed along chromosome 6: the highest correlation is 0.88 and correspond to the 41632_AT probe located at 6p22. Right-clicking on this probe allows to have an external link to the Genecards database (see Figure 4.11(a)): this probe correspond to the E2F transcription factor 3.


Go back to the previous view with the 196 genome-wide profiles and click on Search Elements on the top left panel and do the following (see Figure 4.11(b)):

  1. select GeneSymbol in the drop-down menu
  2. type E2F3 in the right box
  3. click on Find first
  4. wait for the search to be completed (it may take few seconds)
  5. zoom-in in the X and Y scale (see Figure 4.7(b)) until to see the E2F3 gene structure (see Figure 4.11(c))

The E2F3 gene is located in the amplified region previously detected.

Figure 4.11: E2F3 is correlated with DNA copy number
[External links - Genecards]Image GTCA-E2F3 
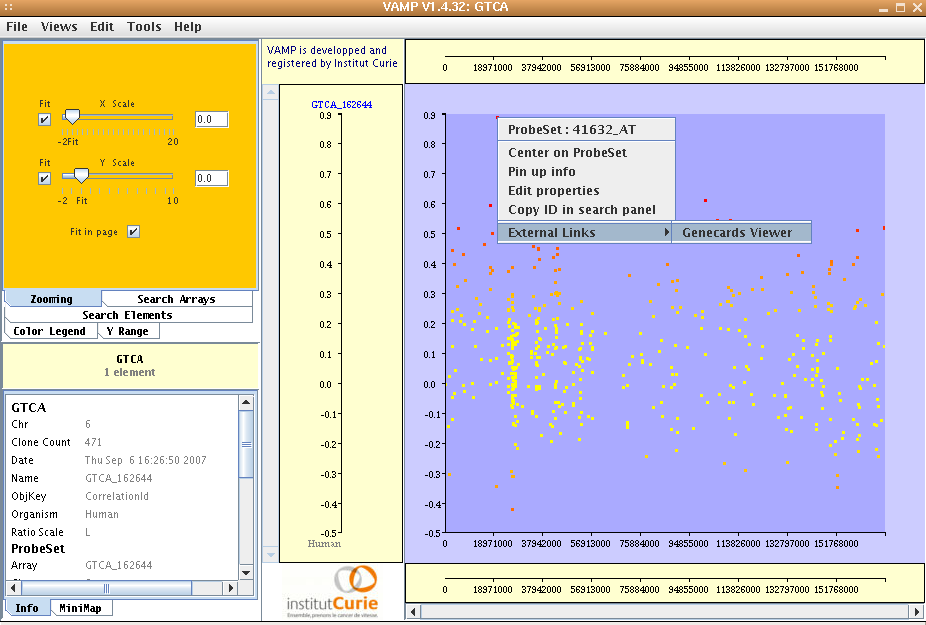
[Search panel - E2F3]Image search-gene 
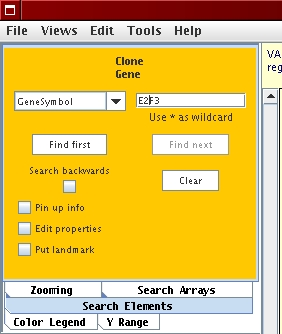
[E2F3 gene structure - Introns are in yellow, exons in red and 3' UTR in green]Image E2F3


next up previous contents
Next: 5. Analysis example - Up: 4. Analysis example - Previous: 4.3.4 Candidate genes   Contents
2007 - Institut Curie Bioinformatics unit