The visualization of the samples which share the minimal amplified regions is available within the interface:
|
[Center on minimal amplified region at 8q22-8q23] 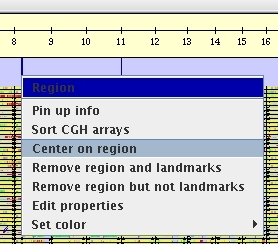 [Zoom-in in X and Y scale]
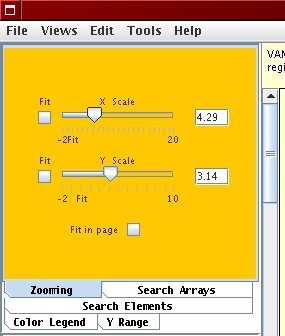 [View menu - Highlight Minimal Alterations]
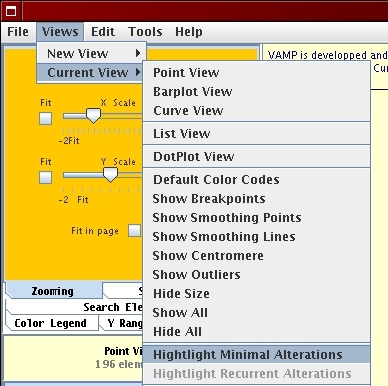 [Sort CGH Arrays]
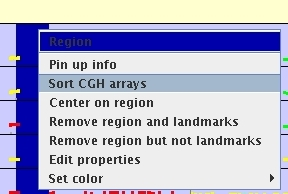
|