Next: 4.3.3 Visualization of the
Up: 4.3 Minimal Alteration computation
Previous: 4.3.1 Parameters settings
Contents
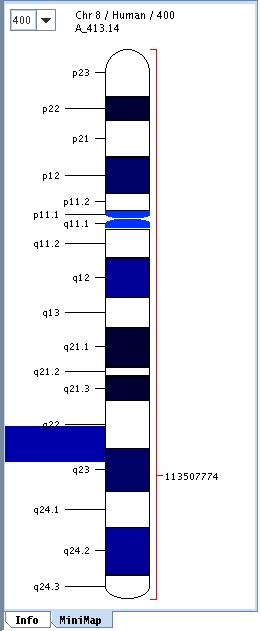
Once the search is completed, the minimal amplified regions are displayed as vertical blue lines (minimal amplified regions are located on chromosomes 6, 8 and 11). In order to see the accurate location of the regions with respect to the cytogenetic bandings do as follows (see Figure 4.6):
- in the bottom left corner click on Minimap to display the chromosome image with cytogenetic bandings
- in the main panel mouse over the sample profiles for chromosome 6, 8 and 11 and you will see that the minimal amplified regions are highlighted in blue in the minimap panel
Figure 4.6:
Minimap and minimal amplified region at 8q22-8q23
|
|
2007 - Institut Curie Bioinformatics unit