Next: 3.3.11.2 Visualizing results
Up: 3.3.11 Correlation Analysis
Previous: 3.3.11 Correlation Analysis
Contents
Assuming that such paired profiles have been loaded within VAMP (see section 4.4 for an example), the analysis can be launched from the menu Tools  Correlation Analysis Compute:
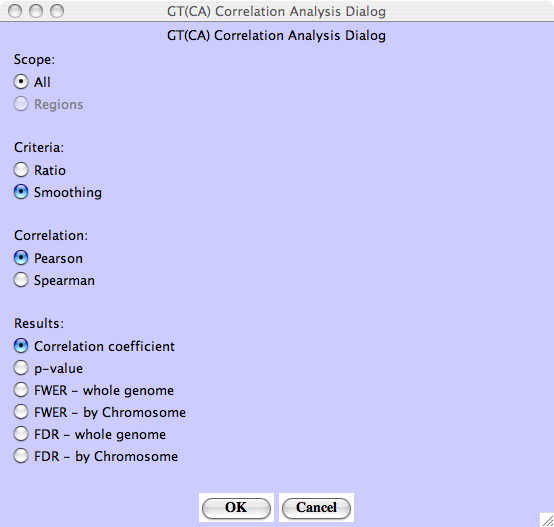
Figure 3.67:
- ``Compute'' Dialog for Correlation Analysis.
|
|
Several parameters can be chosen to run a Correlation Analysis
- scope:
- should correlation coefficients be calculated on all data or only on selected regions (if any) ?
- criteria:
- should correlation coefficients be calculated from copy number ratios, or from smoothed copy number values given by GLAD ?
- correlation:
- which type of correlation coefficient should be used ?The Pearson correlation coefficient measures the extent to which the association between copy number and expression is linear; its sensitivity to outliers makes it suitable to detect associations within regions that are amplified in only few samples. The Spearman correlation coefficient is the Pearson coefficient between measurements ranks; it is therefore robust to outliers and able to detect non-linear associations
Next: 3.3.11.2 Visualizing results
Up: 3.3.11 Correlation Analysis
Previous: 3.3.11 Correlation Analysis
Contents
2007 - Institut Curie Bioinformatics unit