Next: 3.3.11.3 Exporting the results
Up: 3.3.11 Correlation Analysis
Previous: 3.3.11.1 Calculating correlations
Contents
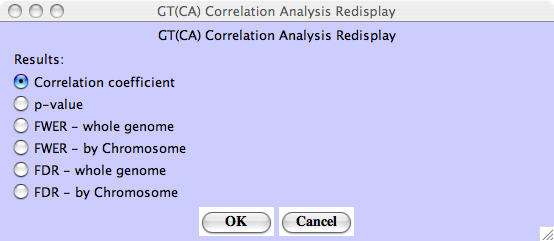
The last parameter in Figure 3.67 allows to choose which results should be displayed. The choice may be made before the analysis is launched, but it can also be modified (without further calculations) after the analysis, from the menu Tools  Correlation Analysis Redisplay:
Figure 3.68:
Tools Correlation Analysis Redisplay - Correlation Analysis: Redisplay dialog.
|
|
The Redisplay dialog proposes several options:
- correlation coefficient:
- (default) Pearson or Spearman correlation coefficient, depending on the choice made within the Compute dialog
- p-values:
- significance level assigned to each correlation coefficient
- FWER:
- p-values adjusted for multiple comparison in order to control the Family-Wise Error Rate (FWER), that is, the probability that one or more loci among those selected is a false positive. We use the Holm adjustment procedure, which is more powerful that the traditional Bonferroni procedure
- FDR:
- p-values adjusted for multiple comparison in order to control the False Discovery Rate (FDR), that is, the expected proportion of false positives among those loci selected
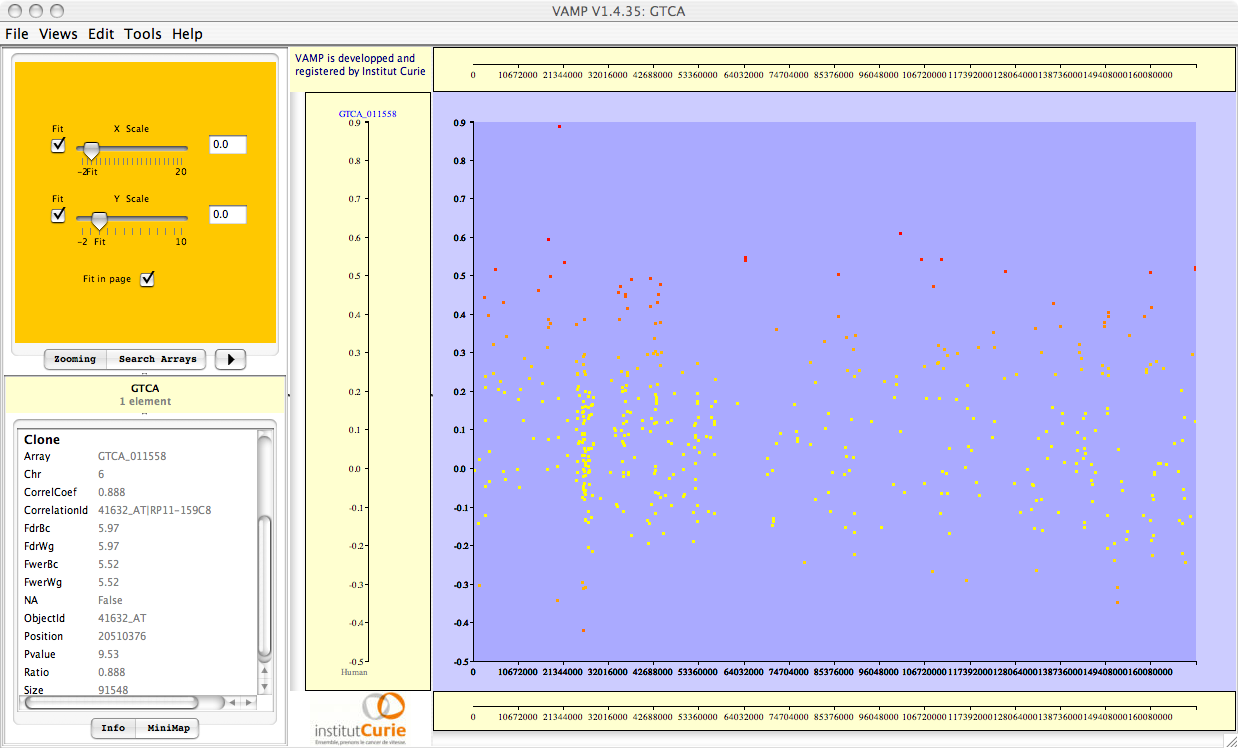
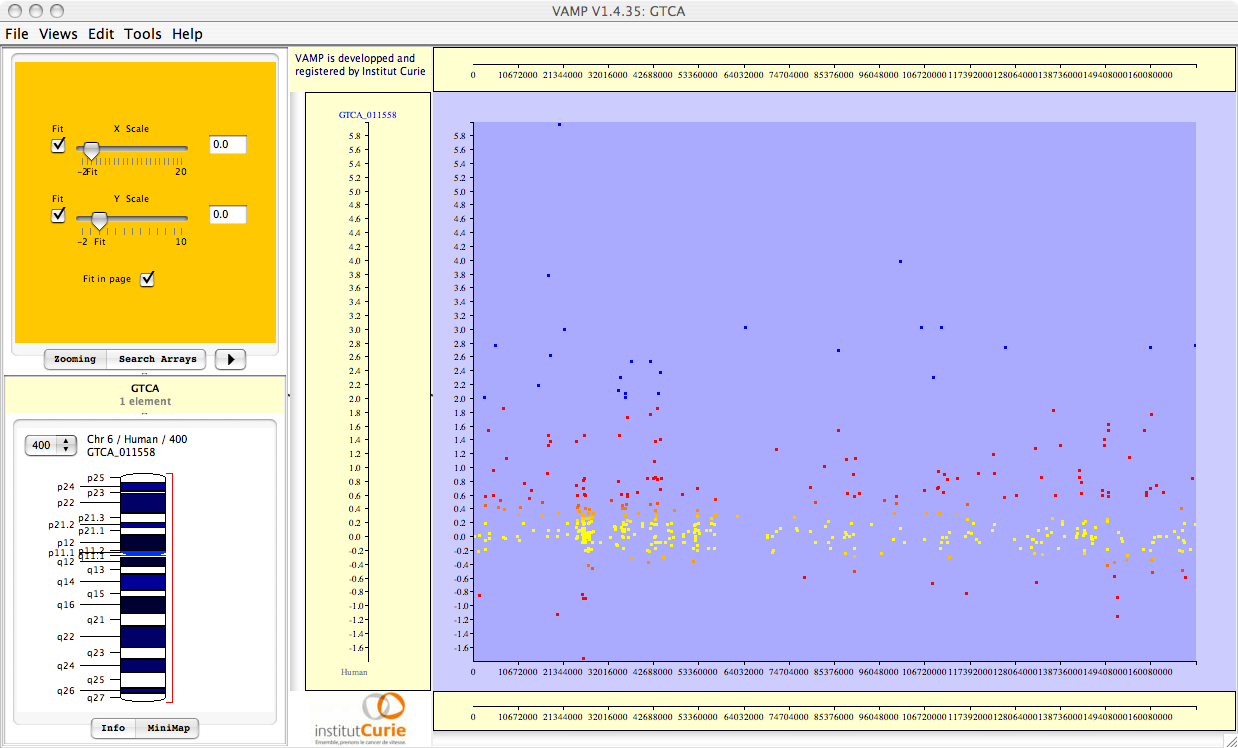
Figure 3.69:
Visualizations of the results of Correlation Analysis. From top to bottom: correlation coefficients; p-values; FWER-adjusted p-values; FDR-adjusted p-values. All p-values are plotted in  scale, and given the sign of the corresponding correlation coefficient.
|
|
These FWER or FDR multiple testing adjustments may be performed for the whole set of genes (``whole genome''), or for each chromosome separately (``by chromsome''), leading to a less conservative adjustment. If only one chromosome is selected, choosing ``whole genome'' or ``by chromosome'' therefore gives exactly the same results.
Importantly, all (adjusted and unadjusted p-values) are displayed in  -scale, so that significant genes (with small p-values) can be easily seen. For example, a gene with p-value
  will be plotted with
  . Also note that all p-values are given the sign of the corresponding correlation coefficient (which may be negative for some genes).
Next: 3.3.11.3 Exporting the results
Up: 3.3.11 Correlation Analysis
Previous: 3.3.11.1 Calculating correlations
Contents
2007 - Institut Curie Bioinformatics unit