Next: 3.2.2.2 Karyotype View
Up: 3.2.2 Data display
Previous: 3.2.2 Data display
Contents
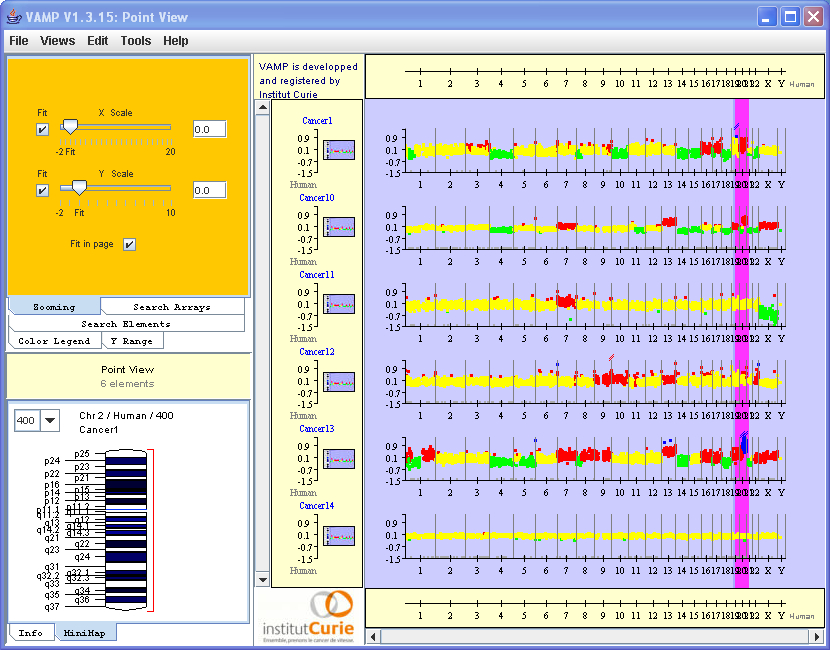
The Profile View can display the profiles as points, barplots or curves (see Figures 3.9 and 3.10). The Profile View can also display symbols for chromosome telomeres and centromeres, and can show the results of CGH ratio statistical analysis (e.g. breakpoints, or smoothed signal values, ...) (see section 3.2.2).
Figure 3.9:
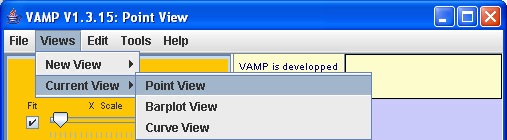
Views  Current View Point View - After importing the genomic profiles (see section 3.2.1), it is possible to switch from one type of representation to another.
|
|
Figure 3.10:
Profile View (Point View).
|
|
The main frame can be split into two frames (see Figure 3.11). The upper frame can, for example, contain a profile for reference when browsing a collection of profiles in the lower frame. The two frames have separate control of Y-scale and Y-scrolling, but have the same X-scale and X-scrolling.
Figure:
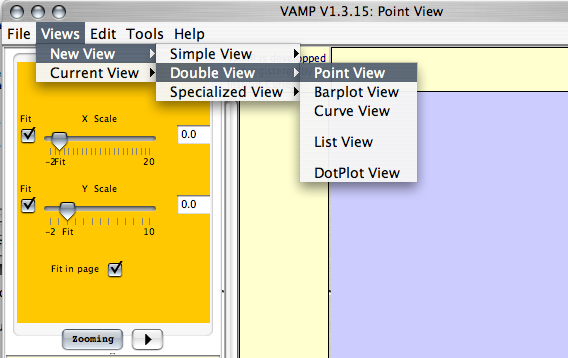
Views New View Double View Point View - The user can open a new double view (see Figure 3.47).
|
|
Next: 3.2.2.2 Karyotype View
Up: 3.2.2 Data display
Previous: 3.2.2 Data display
Contents
2007 - Institut Curie Bioinformatics unit