

Next: 3.2.3 Search
Up: 3.2.2 Data display
Previous: 3.2.2.4 List View
Contents
3.2.2.5 Display additional features
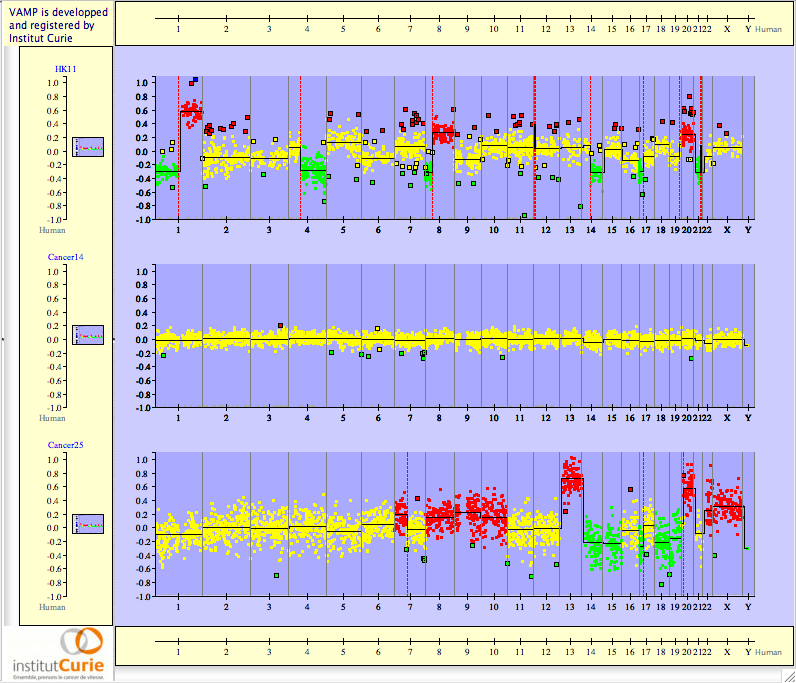
Additional features regarding array CGH profiles can be displayed within VAMP, provided that these features are available in the Array XML files (see 2.2.4). For example, the profiles could have been preprocessed by any segmentation algorithm like GLAD (Hupé et al., 2004), the following additional features are available within the menu View  Current View (see Figure 3.17 and 3.18):
- Gain / Loss Color Code: each clone is colored according to its status (loss in green, normal in yellow, gain in red and amplicon in blue)
- Show Breakpoints: a vertical red dashed line is plotted and represents the breakpoint location
- Show Smoothing Line and Show Smoothing Points: the piecewise constant function estimated by the segmentation algorithm is plotted
- Show Outliers: outliers (see page
![[*]](crossref.png) for a definition of outliers) are black circled.
for a definition of outliers) are black circled.
Figure 3.17:
Views  Current View.
|
|
Figure 3.18:
Additional information with Gained/Lost Color Codes, Show Breakpoints, Show Smoothing Lines, and Show Outliers.
|
|


Next: 3.2.3 Search
Up: 3.2.2 Data display
Previous: 3.2.2.4 List View
Contents
2007 - Institut Curie Bioinformatics unit
![]() Current View (see Figure 3.17 and 3.18):
Current View (see Figure 3.17 and 3.18):
![[*]](crossref.png) for a definition of outliers) are black circled.
for a definition of outliers) are black circled.
