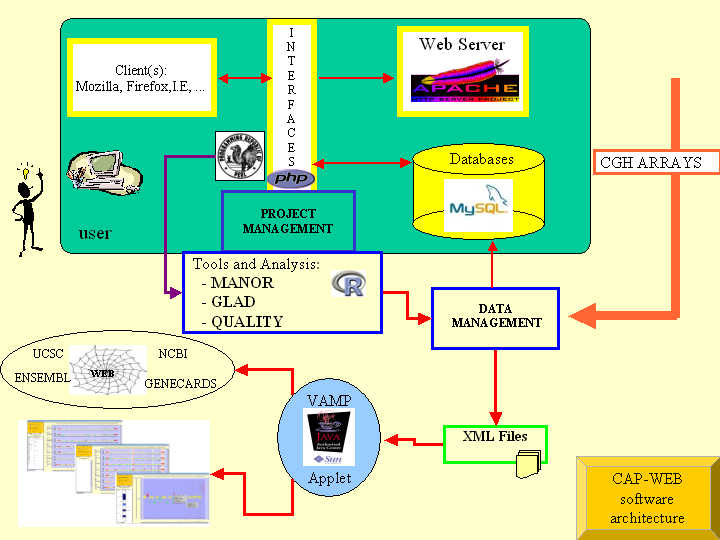
CAPweb (CGH-Array Analysis Platform) is a suite of
tools for the management, visualization and analysis of Comparative
Genomic Hybridization arrays (CGH-arrays). CAPweb has been developed
in the Bioinformatics Unit of Institut Curie as a close
collaboration with biologists and clinicians. It is currently used for
processing the data from about 30 different projects and 3,000 arrays.
CAPweb is a web interface which allows users to carry out the
following bionformatics steps of their CGH-array projects :
Upload in a secure mode the results of CGH-array image analysis (under
Genepix, Spot , MAIA,
more formats soon avalaible) and the annotation of its clones/probes
(name, genome, position). First level analysis of each array, which includes :
Automatic normalization of the data, for correcting experimental
biaises. In our case, the main source of variability is spatial
biases. This is solved with the MANOR package (Neuvial et al, subm), which implements an algorithm based on a spatial trend computation by two-dimensional LOESS (Cleveland, 1992)
and unsupervised classification with spatial constraint (Ambroise, 1996).
Breakpoint detection and status assignment (gain, loss, normal,
amplicon or double deletion) using the new version of the GLAD package
( Hupé et al, 2004). GL
AD is based on an iterative, data-adaptative
smoothing technique : the Adaptative Weights Smoothing (AWS) procedure
(Polzehl et al, 2000).
Synoptic reporting of these results which is proposed to the user for
validation, further analysis or discarding of the analysis.
Integration into VAMP, a graphical interface for Visualisation
and Analysis of Molecular Profiles.
VAMP allows the visual comparison of the array-CGH profiles of a
cohort of patients, or the confrontation of array-CGH, expression and loss
of heterozygosity profiles.
VAMP offers many functionalities
such as computing recurrent alterations, clustering profiles, crossing
with clinical or biological annotations, performing syntenic projection
onto the genome of another species.
We have also set up an integrative public database for the integration
of cancer CGH arrays, which comprises data from Snijders et
al (2001), Pollack et al (2002), Veltman et al
(2003), Nakao et al 2004, Douglas et al (2004) and de
Leeuw et al (2004).
|