CAPweb tutorial
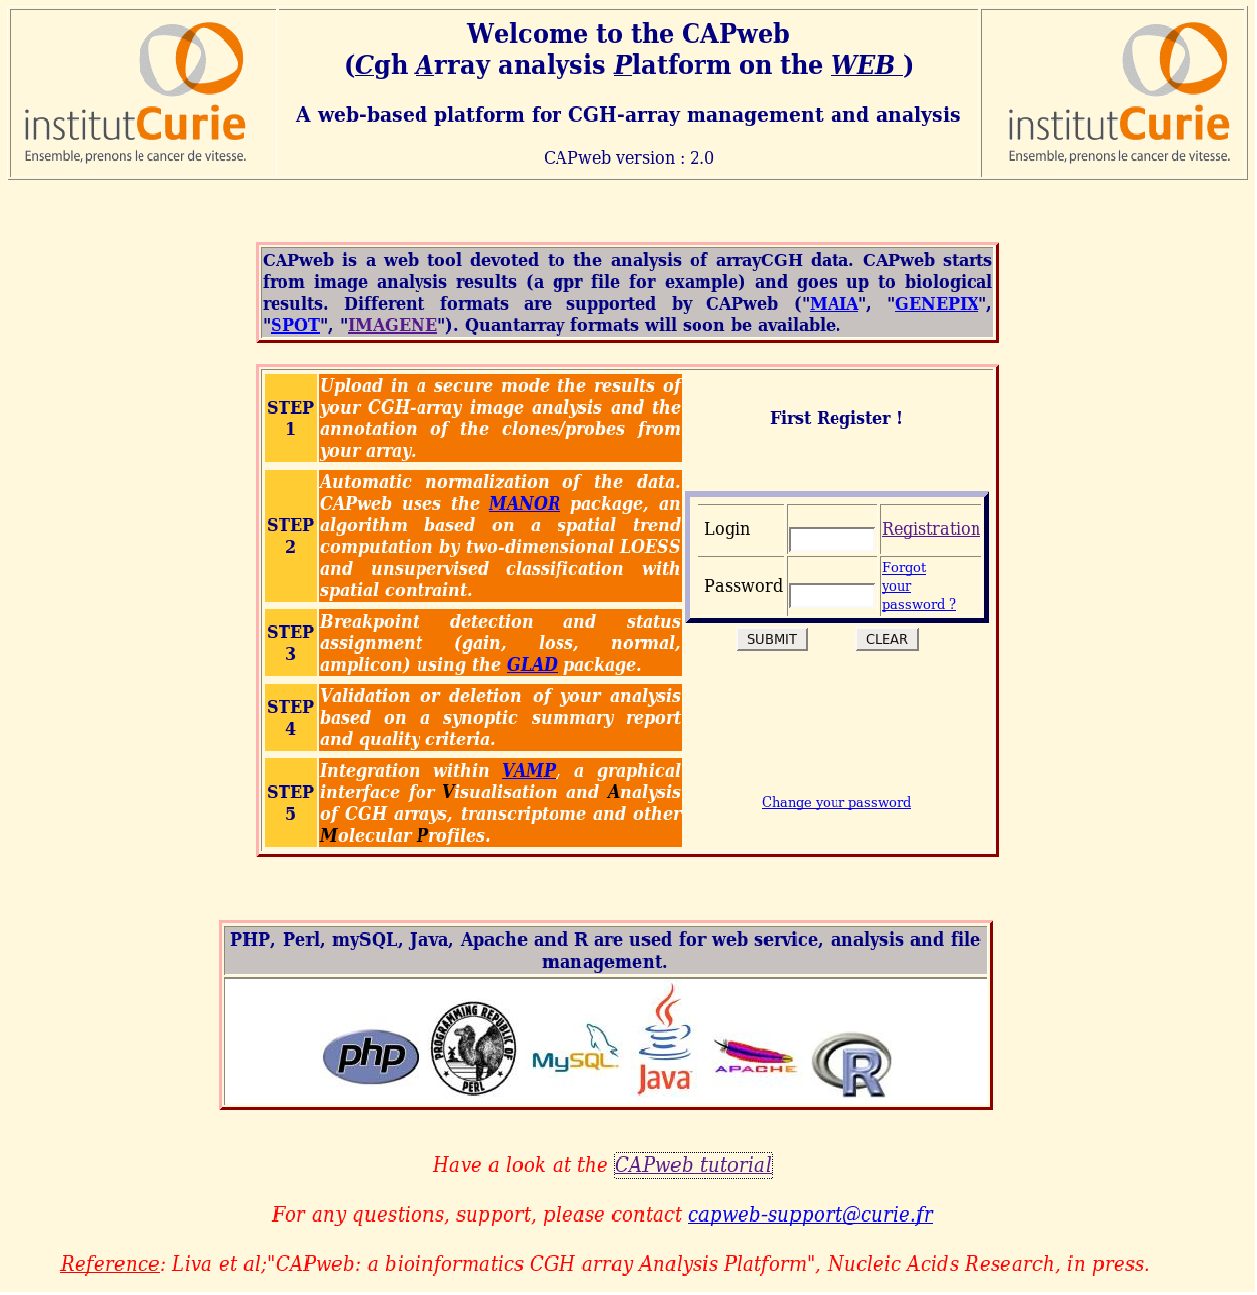
CAPweb is a user-friendly interface to store, analyze and visualize CGH-array data .
CAPweb starts after image analysis (a gpr file for example) and goes up to the biological results. Different input format are supported ("MAIA", "GENEPIX", "SPOT","IMAGENE").
- STEP 1 : Upload in a secure mode the results of CGH-array image analysis and the annotation of the clone/probes from the array.
- STEP 2 : Automatic normalization of the data. CAPweb uses the MANOR package, an algorithm based on a spatial trend computation by two dimensional LOESS and unsupervised classification with spatial contraint.
- STEP 3 : Breakpoint detection and status assignment (gain/loss/normal/amplicon) using the GLAD package.
- STEP 4 : a summary report of these results is proposed to the user for validation, further analysis or discarding of the analysis.
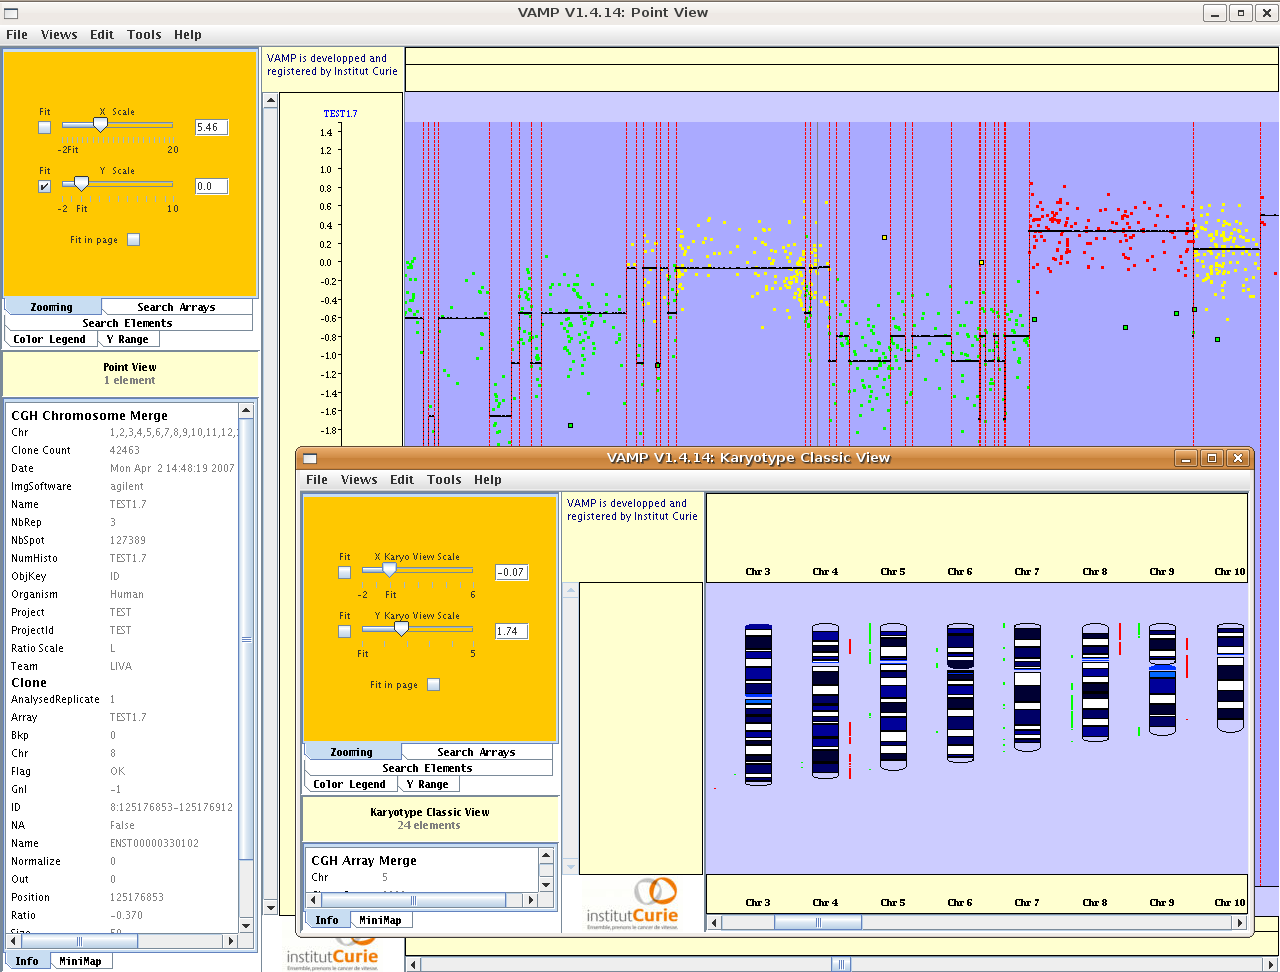
- STEP 5 : Integration into VAMP, a graphical interface for Visualisation and Analysis of CGH arrays, transcriptome and other Molecular Profiles.
Register, Upload and manage your project
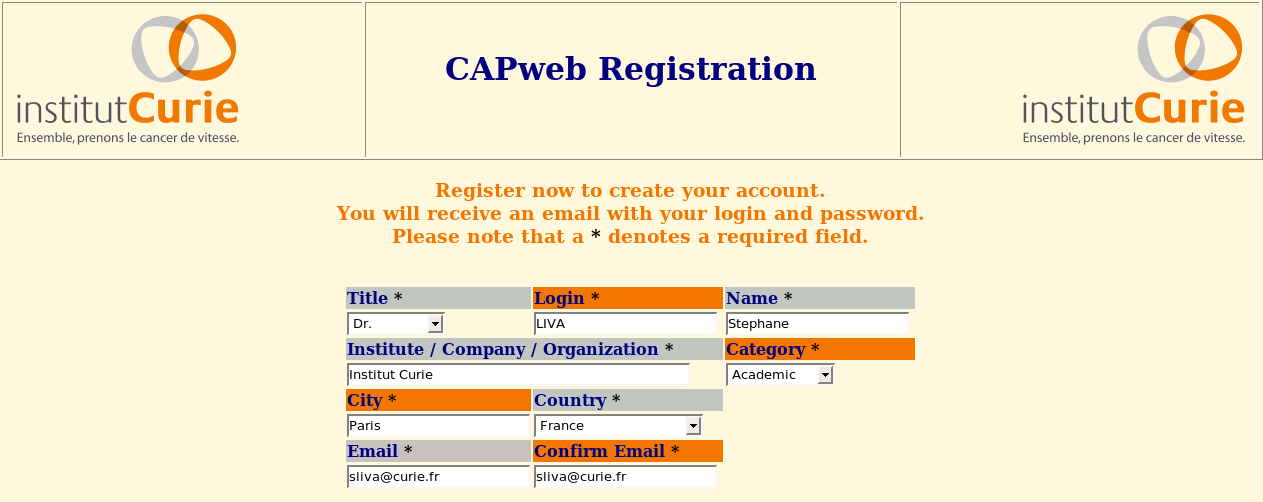
Register :


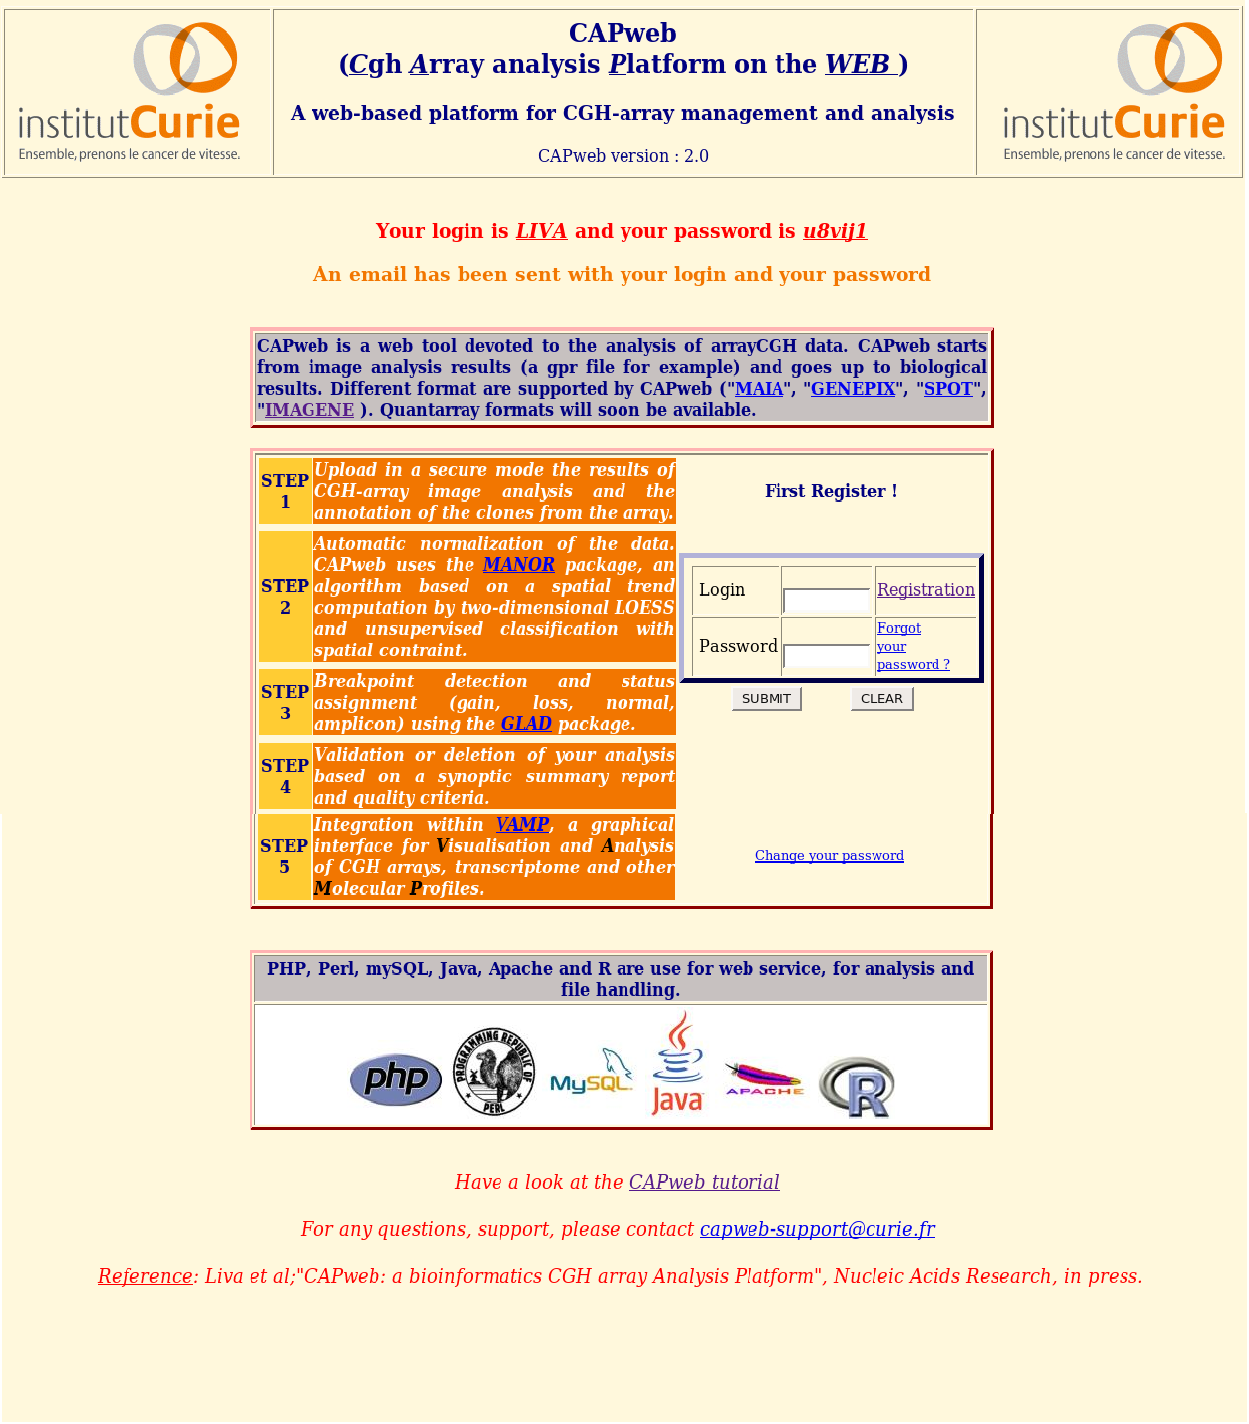
The user fills the registration form in and receives an email with the login and the password.
The login and password are display in the home page.
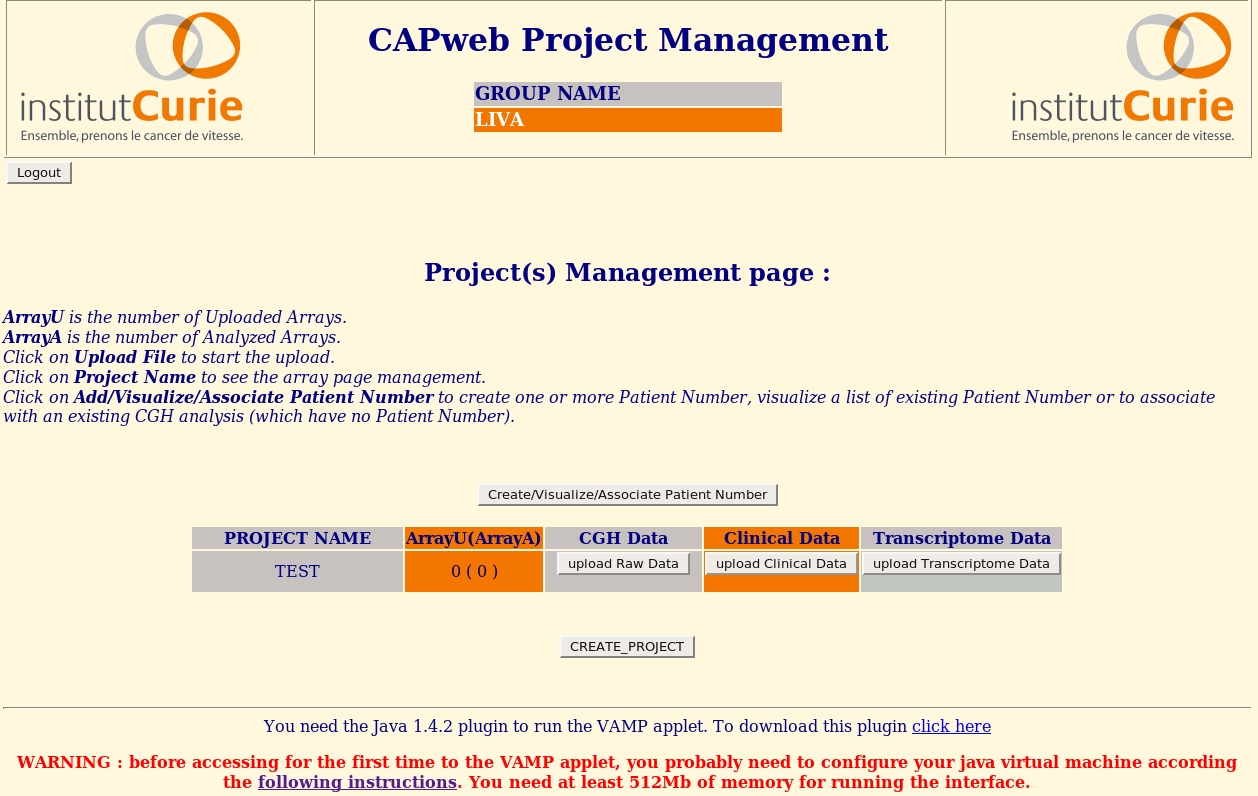
Create your own project :


The user can create one or more project by giving a name. At this step the user can upload his own files.
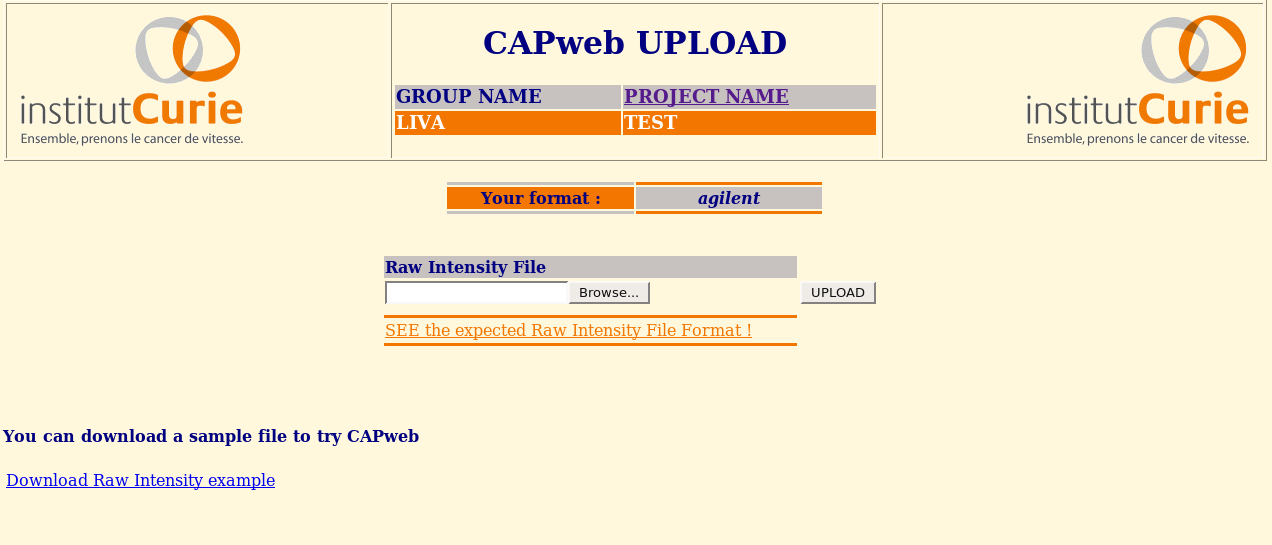
Upload your files :


The user uploads the result of CGH-array image analysis files (here agilent format). The user can download the demo file to see the CAPweb pipeline. There is also an image of expected raw data file.
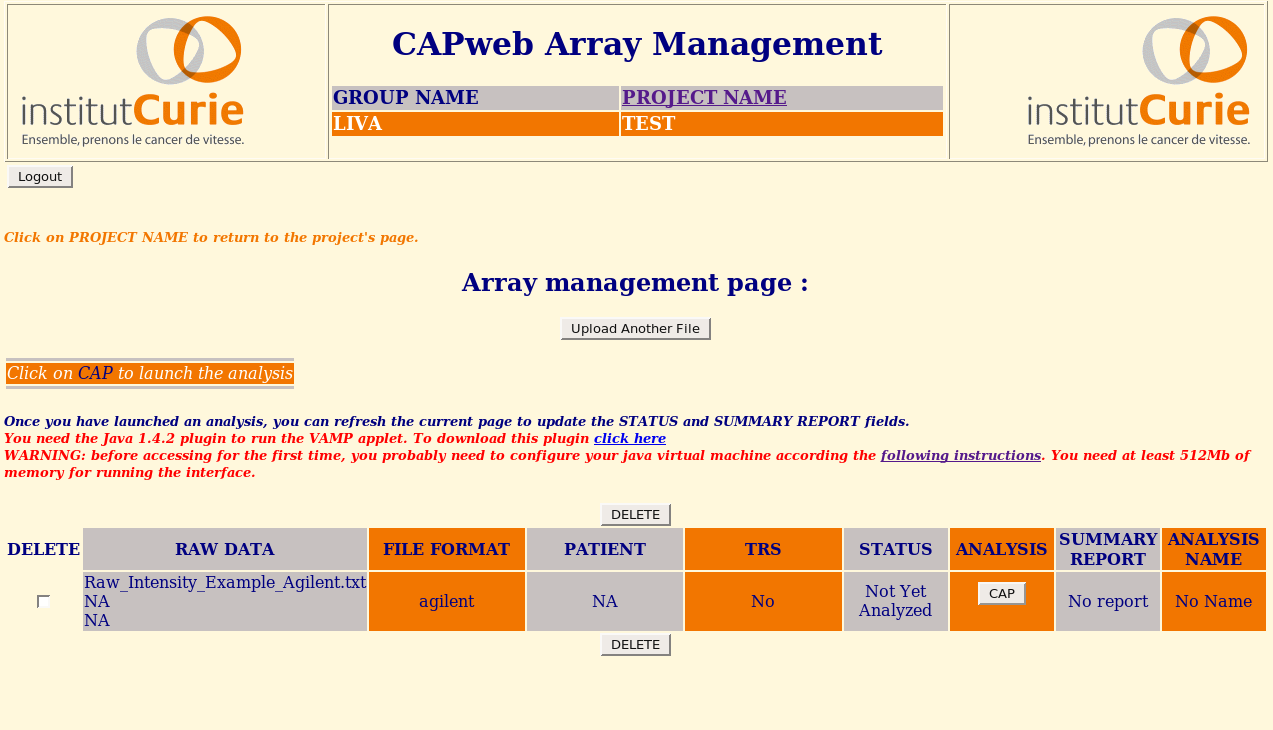
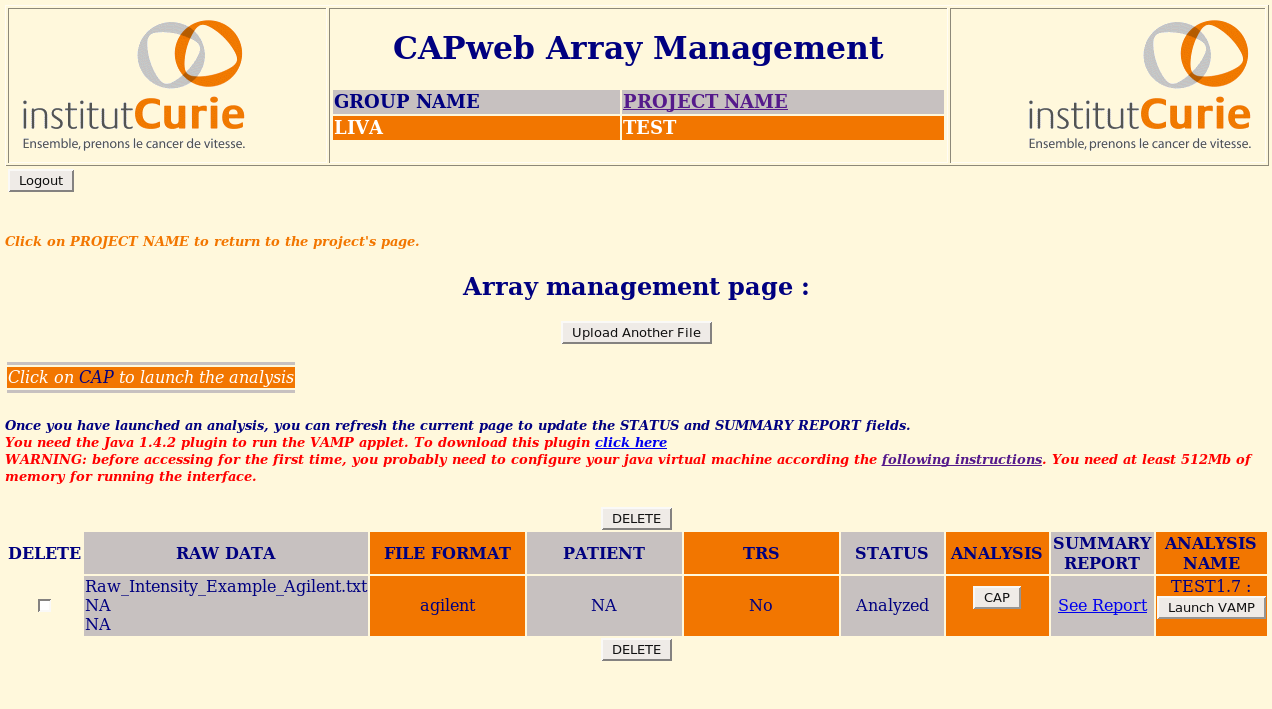
Manage your project :

Once uploaded, the user has access to some information about his file:
- The name of the file
- The format of the uploaded file
- The name of the Patient (associated to the clinical data)
- The name of the Transcritome file (associated to the Patient)
- The status of the analysis ( "Not yet analyzed", "In analysis", "Analyzed", "Deleted" )
- An access to the Analysis page
- An access to the summary report page
- The analysis name in the VAMP software
The user can upload other files or come back to the project home page.
When the user clicks on CAP, a new window opens to start the analysis. The CAPweb chip page is always open.
Launch the Analysis
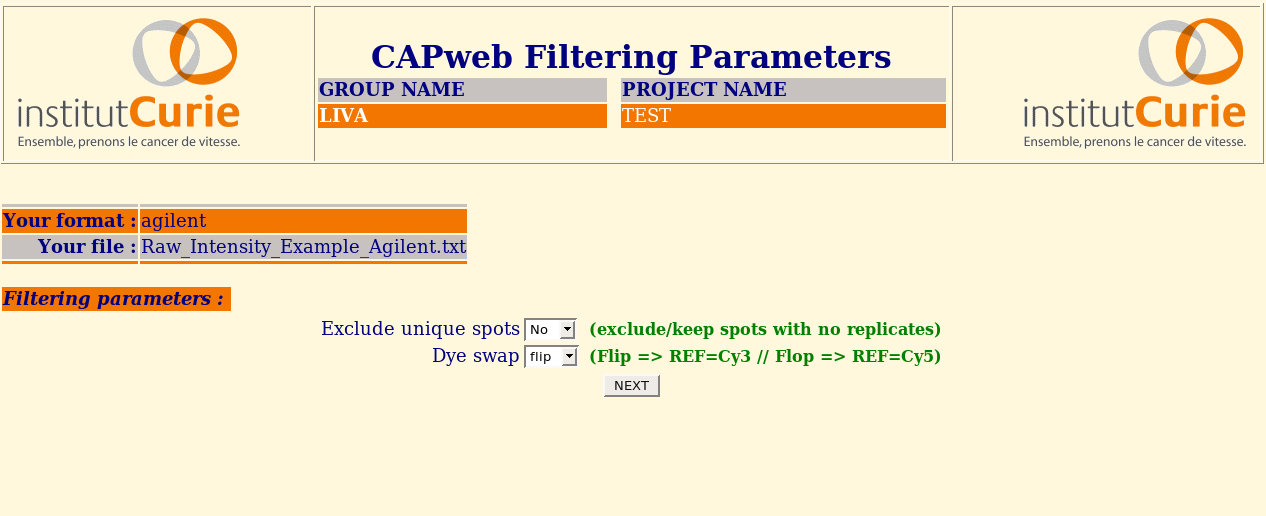
Parameters for the filtering :

There are 2 parameters:
- Exclude unique spot => exclude or keep spots with no replicates.
- Dye swap => Flip = the reference is Cy3; Flop = the reference is Cy5.
Parameters for MANOR and GLAD :

Advised users can modify MANOR and GLAD parameters. Here is a list of these parameters :
- Normalization steps
- LOESS (correction of intensity dependant effect)
- 2D LOESS (correction of spatial effect)
- MANOR parameter
- MANOR.ispan (controls the degree of smoothing, it corresponds to the proportion of points that are included in the neighbourhood of each point for local regression)
- GLAD parameter
- GLAD.mediancenter
- GLAD.qlambda
- GLAD.bandwidth
- GLAD.lambdabreak
- GLAD.param
- GLAD.alpha
- GLAD.msize
- GLAD.lambdaclusterGen
- GLAD.amplicon
- GLAD.deletion
- GLAD.deltaN
- GLAD.forceGL1
- GLAD.forceGL2
- GLAD.nbsigma
- GLAD.MinBkpWeight
The user may check or change the parameters before launching the CAPweb pipeline.
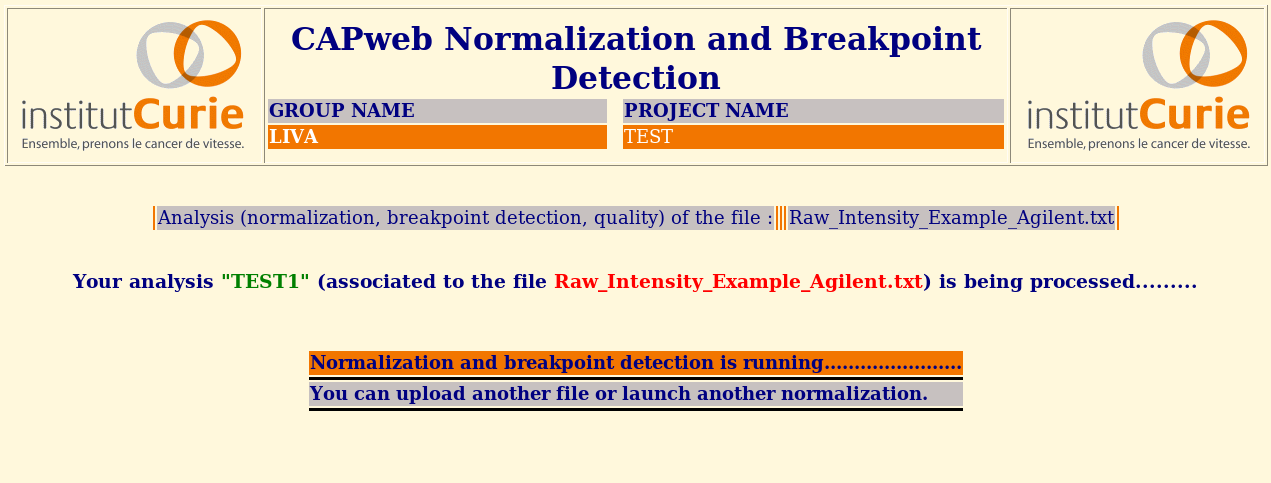
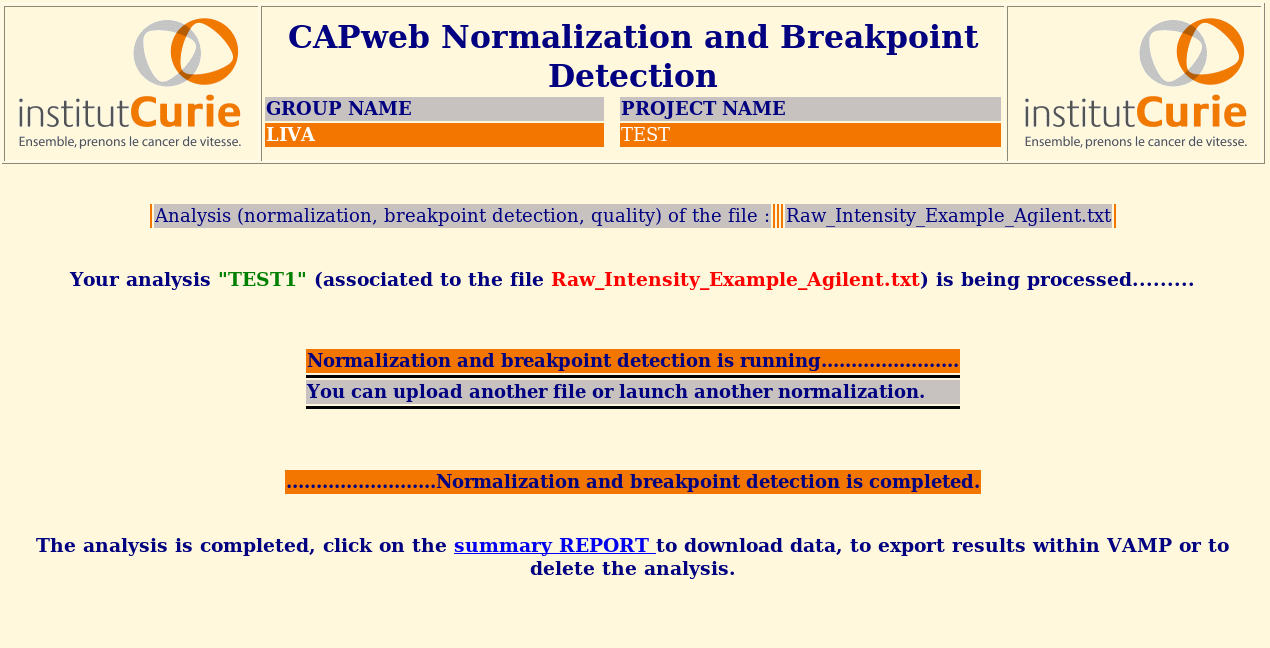
CAPweb :


When the analysis is running, the user may upload another file or launch another analysis.
If the user accidently closes the analysis window before the end, normalization and breakpoints detection keep working in background. There is no need to restart the analysis. Once the analysis will be completed, the corresponding summary report will appear on the CAPweb array page.
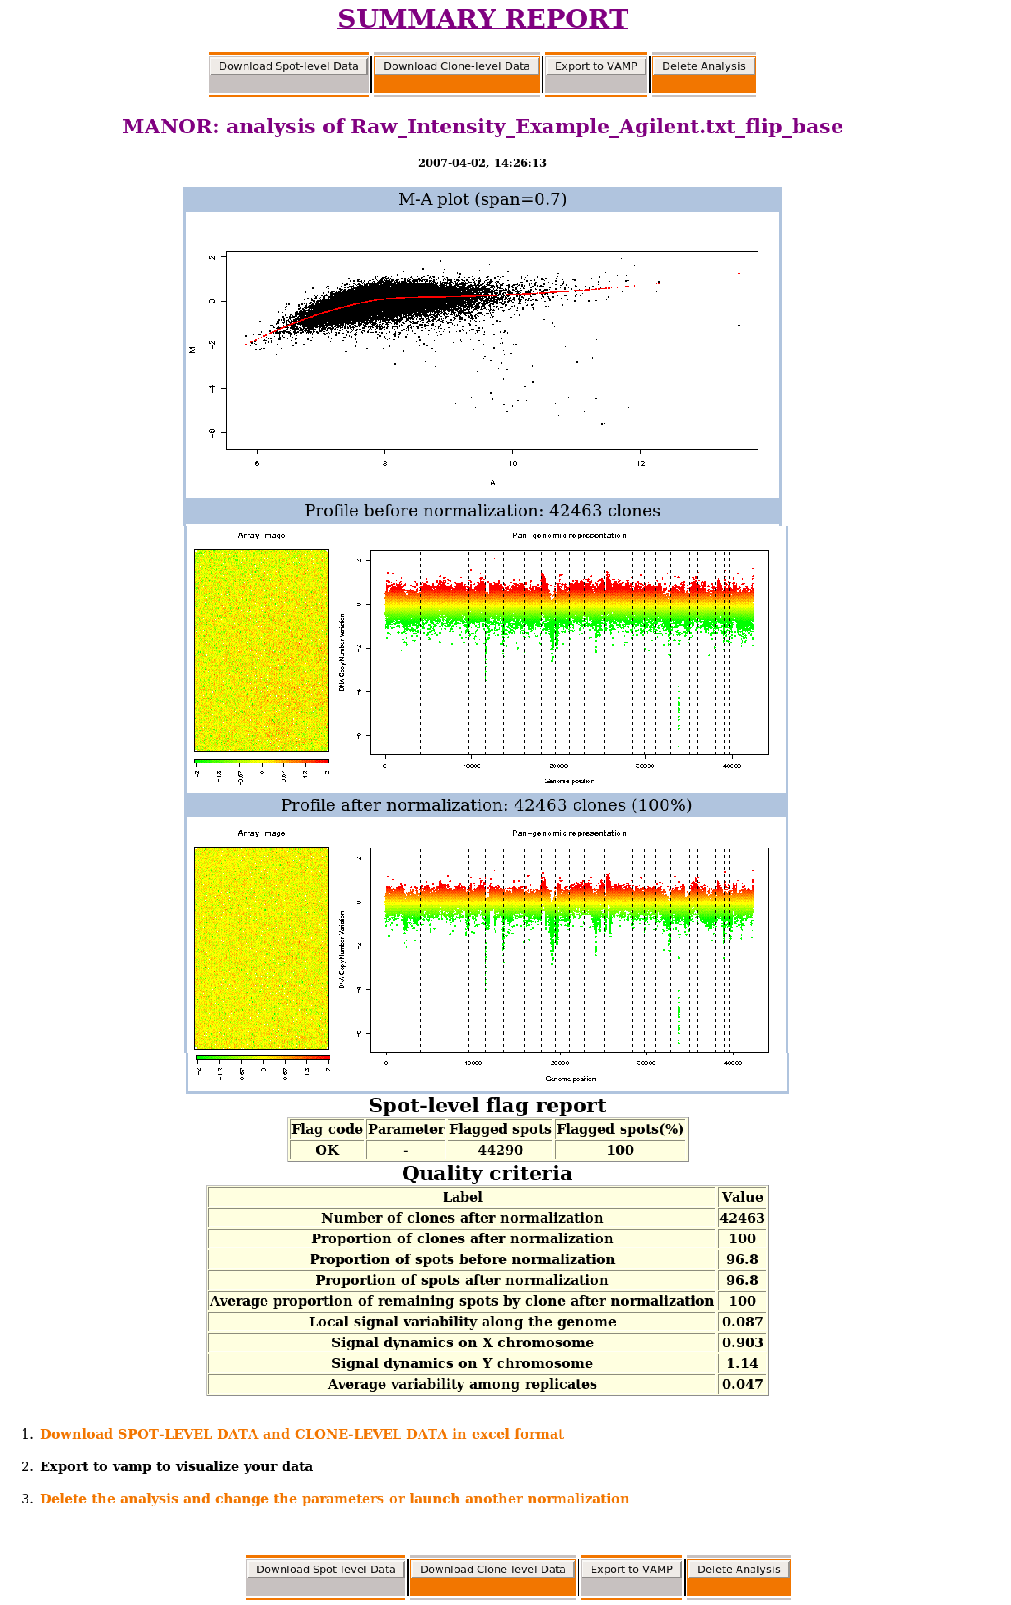
Summary report and VAMP 
The summary report is a crucial step in the CAPweb pipeline. The user decides to keep or to discard the analysis. The user can also export the raw data and the analysed data.
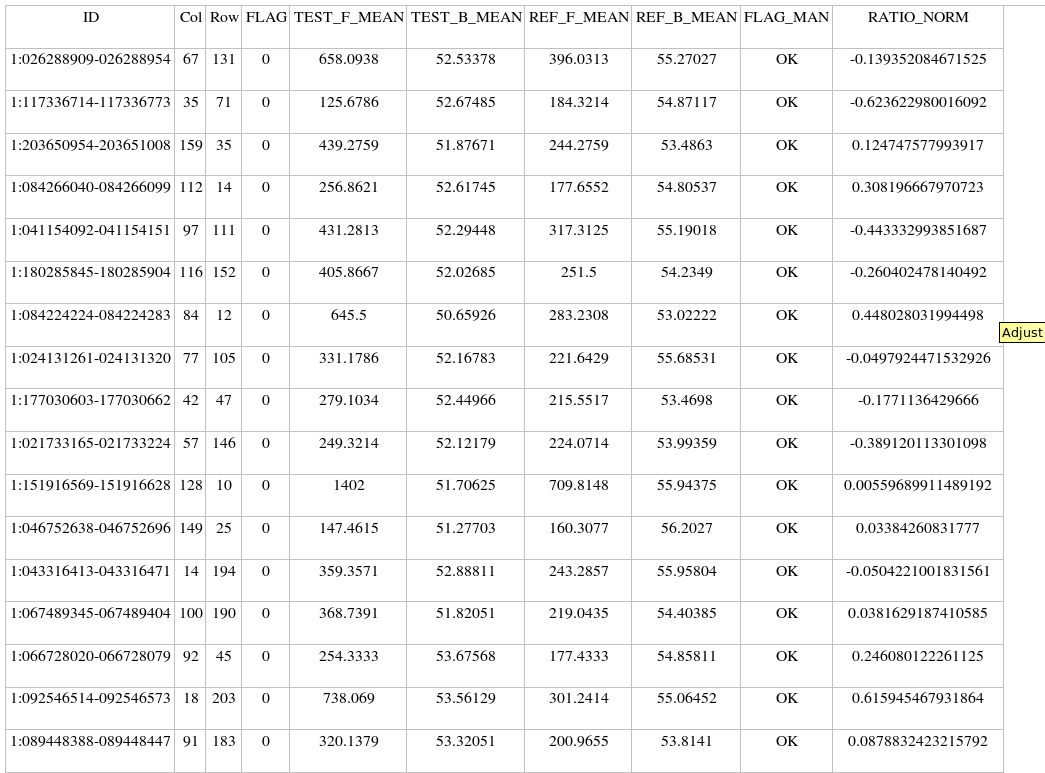
Export Spot-Level Data :

The export spot-level data format is the excel format.
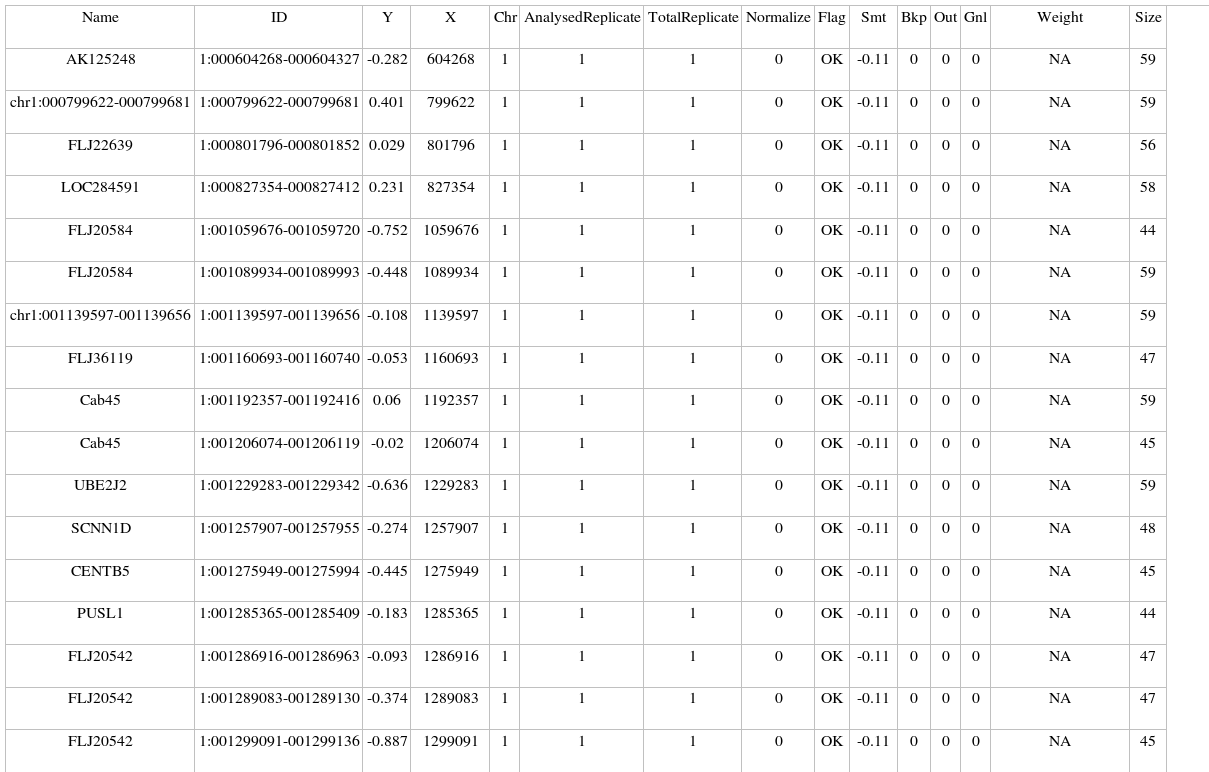
Export Clone-Level Data :

The export clone-level data format is the excel format.
Delete the analysis :

The user can delete the analysis and can restart the same analysis with other parameters.
Export to VAMP :

The user can integrate the analysis in the VAMP software. VAMP requires the Java 1.4.2 plugin.
To download the plugin for windows click here
Status of the analysis in the CAPweb array page :

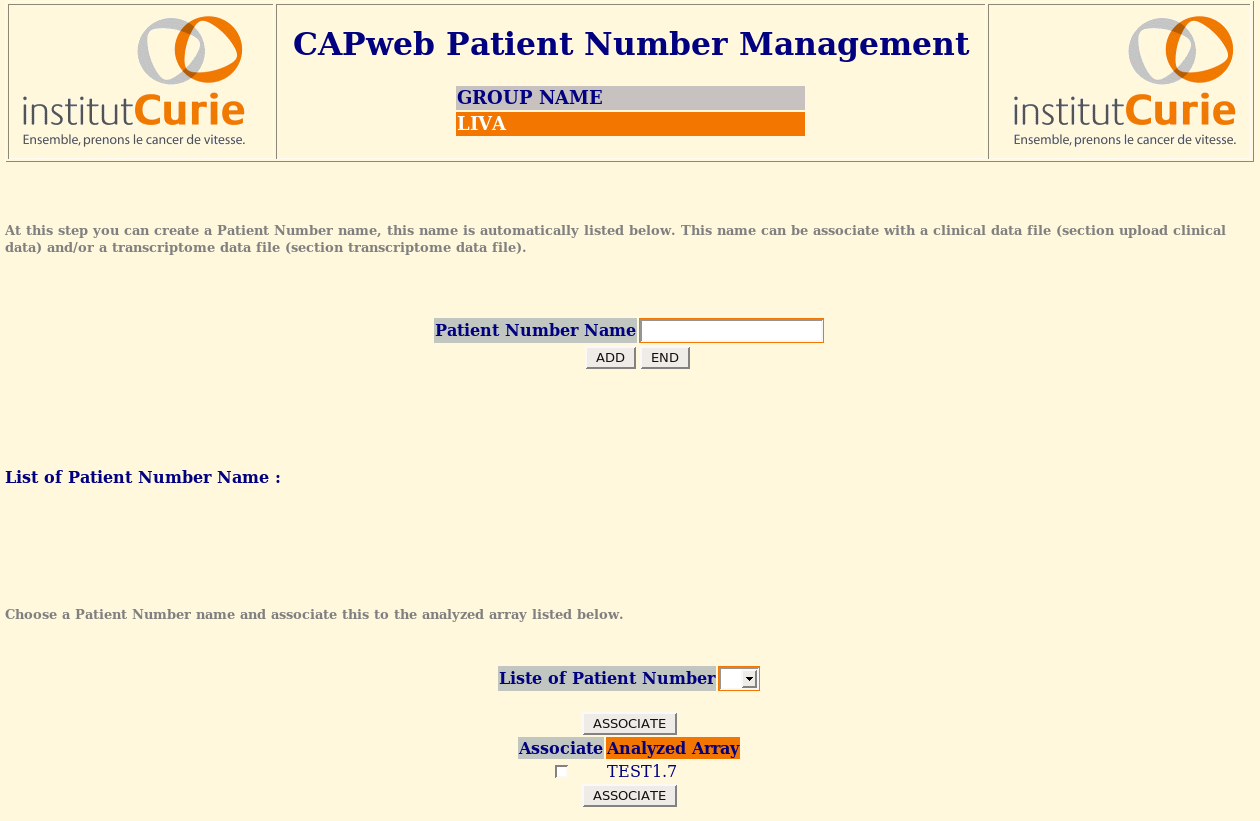
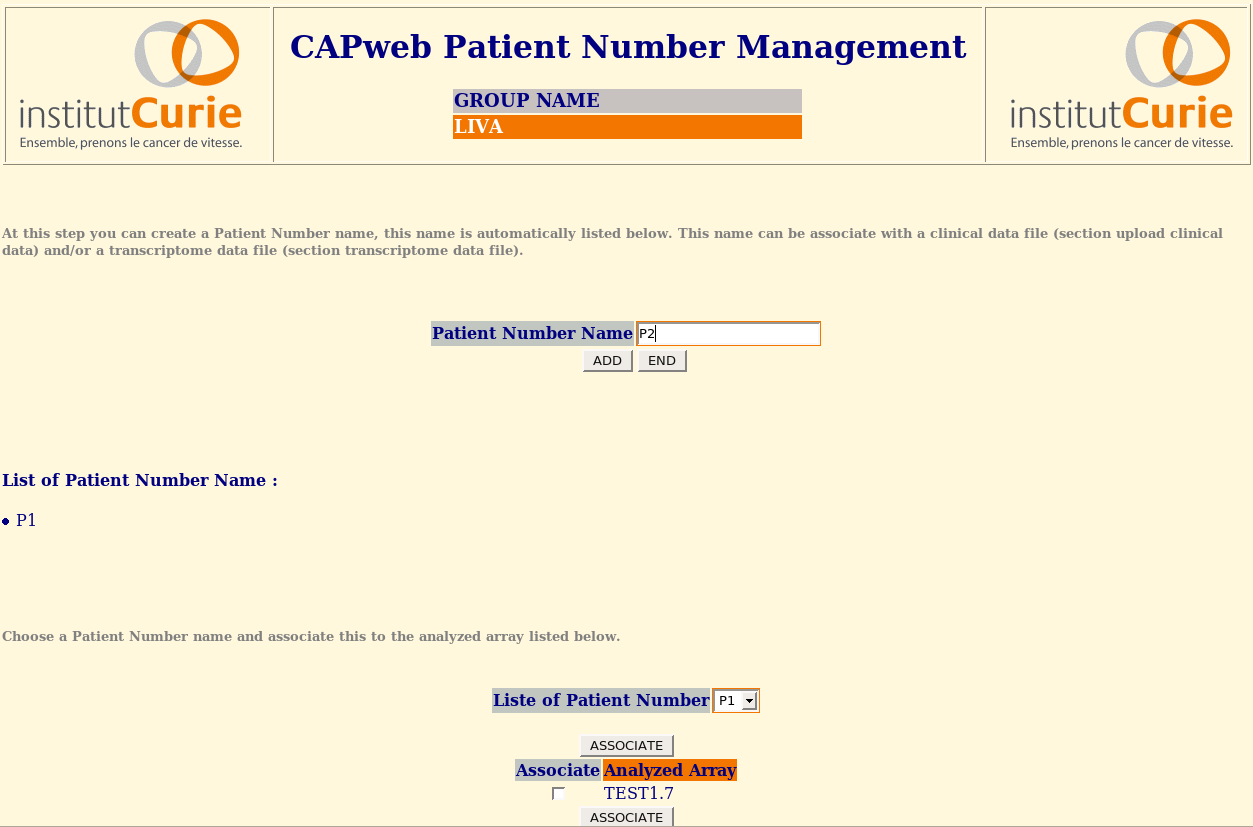
Patient Number / Clinical and Transcriptome Data
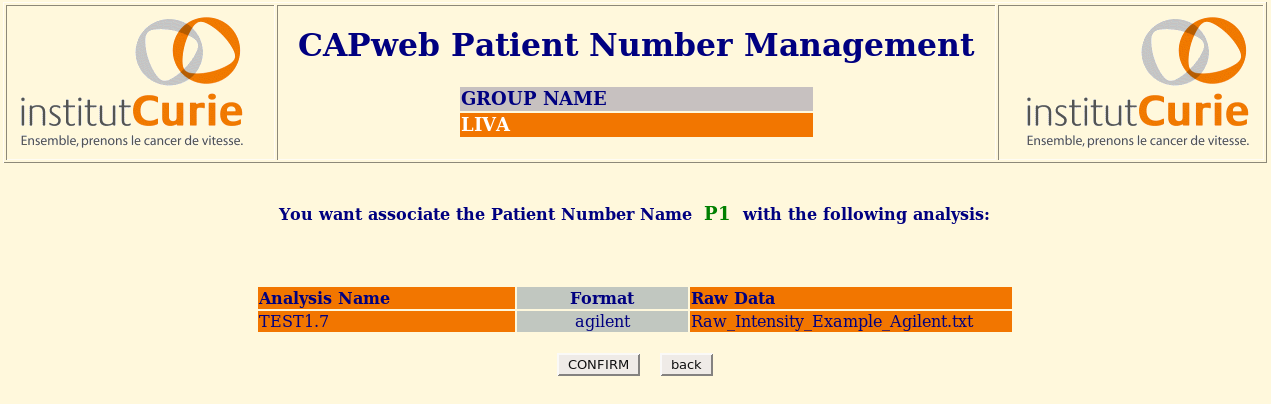
Create / Visualize / associate Patient Number :
The user creates one or several Patient Number
At this step the use can associate the Patient Number with an analyzed array
(the user can associate a patient number when launching the analysis)
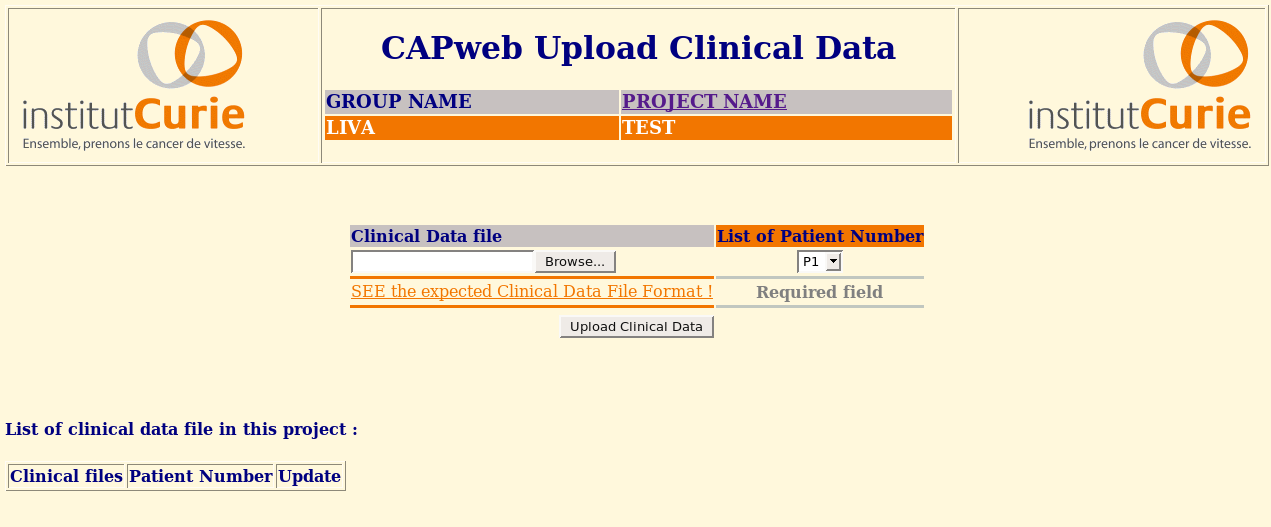
Upload Clinical Files :
The user uploads a clinical data file and associate the file with a patient number
There is also an image of expected clinical data file.
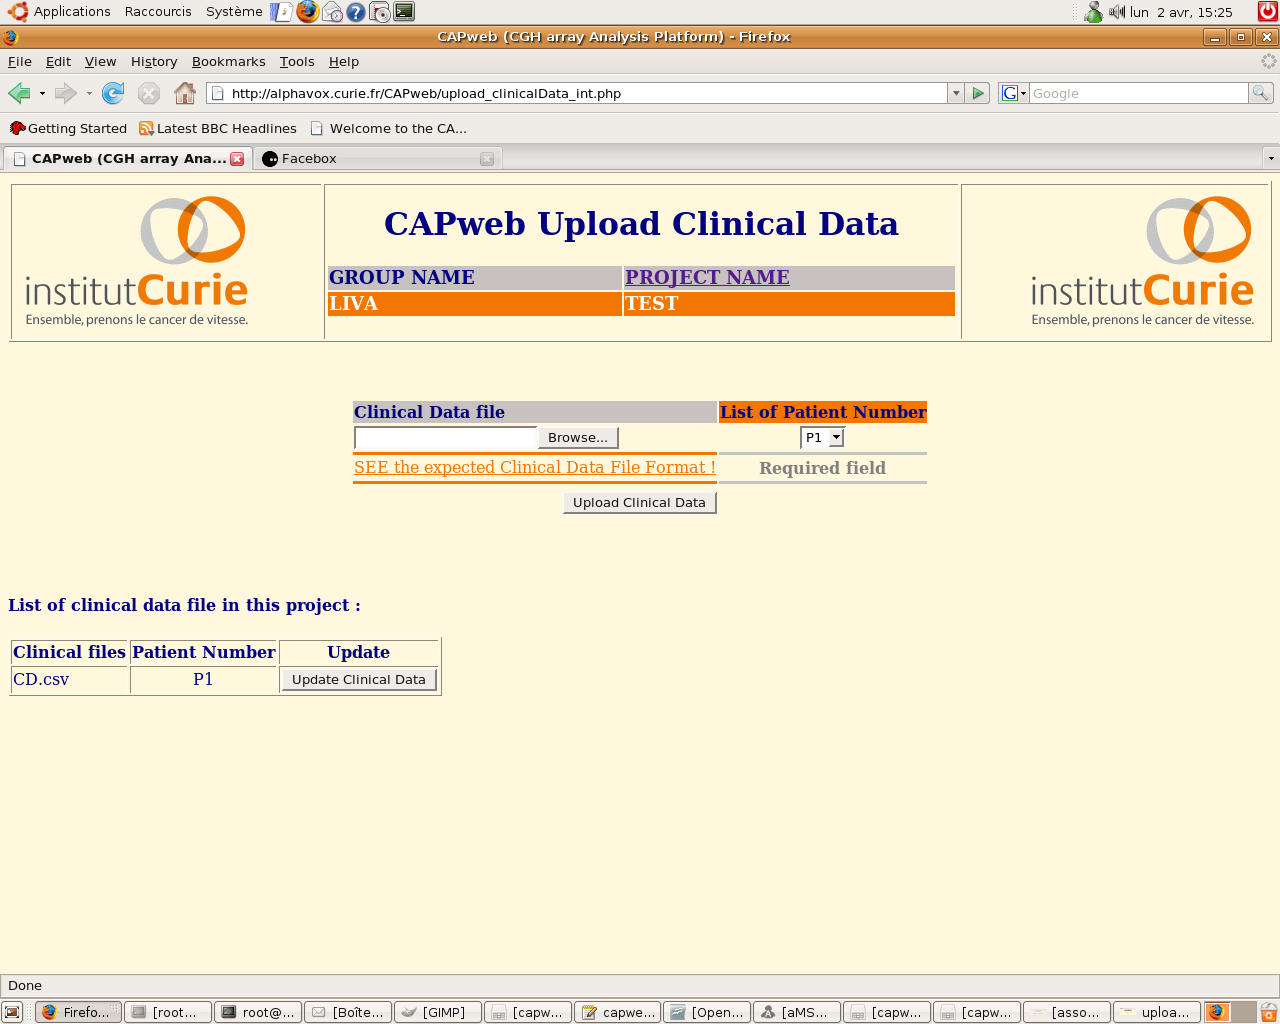
The use can modify directly the clinical data file (update button).
The file is display in the web page and the user can add or delete some clinical data
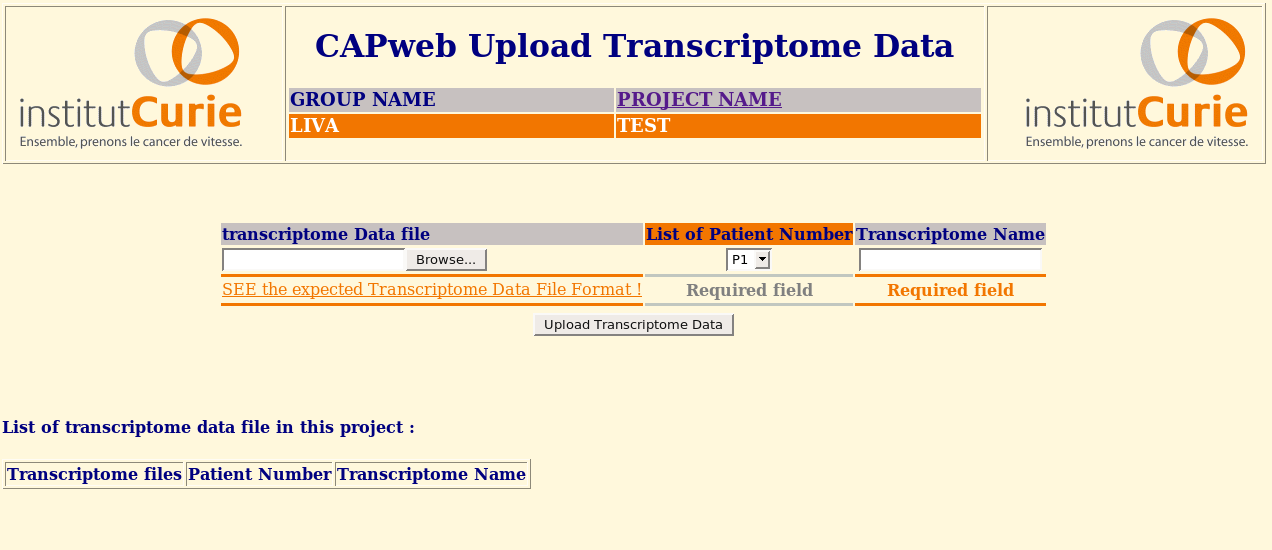
Upload Transcriptome Files :
The user uploads a transcriptome data file, give a name and associate the file with a patient number
There is also an image of expected transcriptome data file.
CAPweb and VAMP are accessible at http://bioinfo-out.curie.fr/CAPweb and http://bioinfo-out.curie.fr/vamp
|