TrAP - Transcriptome Analysis Pipeline
Sabrina Carpentier1, Séverine Lair1, Carlo Lucchesi2, Nicolas Servant1, Philippe La Rosa1, Emmanuel Barillot1.
1. Institut Curie Bioinformatics Unit.
2. Institut Curie Inserm U509.
TrAP is a pipeline dedicated to the transcriptome microarray analysis.
It was developped by the bioinformatics team of the Institut Curie and is currently used by the biologists
of the institute. The aim of this tool is to help users to carry out biological studies (on tumorigenesis or
tumour progression) to successful conclusion(s) through a user-friendly interface.
TrAP allows users to:
- store and manage all required data such as sample information, experimental design description and raw
or normalized data files
- analyze data with specific methods that cover different approachs of the transcriptome analysis:
- normalization,
- class discovery,
- class comparison,
- functional analysis
- visualize and export the results (pictures, data files)
The following figure illustrates the different steps of a microarray experiment and highlights TrAP involvement.
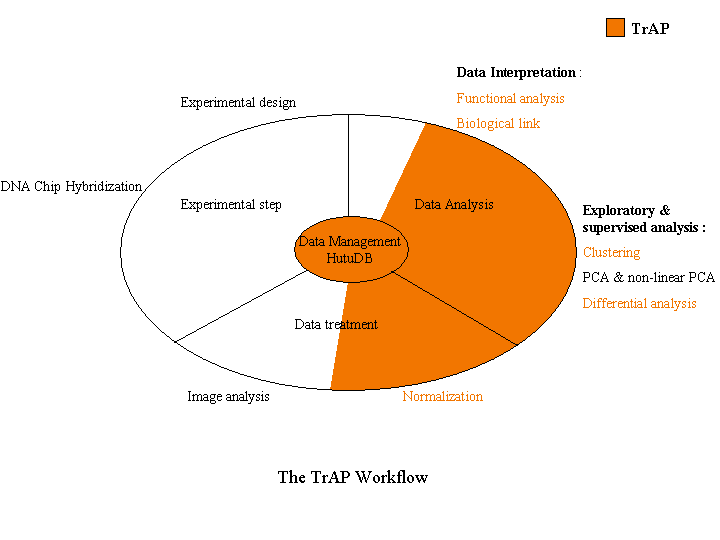
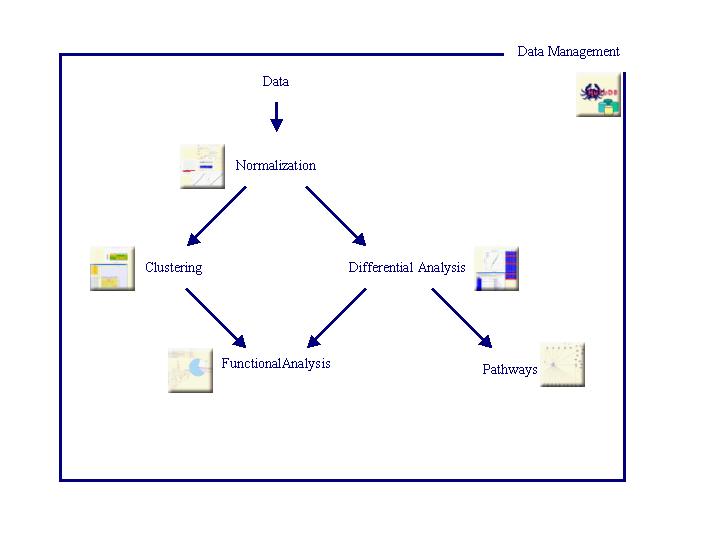
The different steps, implemented in TrAP, are described below (Click on icons to get more information):
 TrAP was developed in PHP, HTML and Javascript, uses the Oracle database system and the R statistics platform.
Data management is an important part of an analysis pipeline. It consists in storage, organization and management of any used or generated data.
The data management tool used is HuTuDB-transcriptome.
The aim of normalization is to extract the biological information from the microarrays and to remove experimental biases.
Concerning Affymetrix Genechip arrays we choose to integrate these three methods:
- MAS5 (Microarray Analysis Suite)
The MAS5 method, developped by Affymetrix, uses a log scale measure, which relies upon the difference PM - MM (Perfect Match - Mismatch) with the intention to correct non-specific binding. But MM may be detecting signal as well as non-specific binding.
See Hubell (2001), for more details.
- RMA (Robust Multi-array Average)
RMA pioneered the approach of disregarding the control mismatch probes. It is based on a Robust Multi-array Average (RMA) of background adjusted, normalized (quantile normalization) and log-transformed PM values.
However, this approach sacrifices some accuracy for large gains in precision.
RMA consists of three steps:
- backgroung correction
- quantile normalization
- median-polishing
See Irizarry & al. (2003), for more details.
- GCRMA
GCRMA is a new version of RMA that uses a new background adjustment: the GC content of the probe sequence is used to reduce variance in the (control) probe levels.
See Wu & al.(2003), for more details.
We recommend the use of GCRMA for Affymetrix Genechip arrays. TrAP alows you to evaluate the quality of the normalization thanks to boxplot, qqplot and MvAplot:
The two-colors cDNA microarrays are normalized with the within print-tip group intensity-dependent normalization (Yang & al.) using the lowess function. If spatial effects are detected, they are corrected with an ANOVA (ANalysis Of VAriance) model.
The clustering purpose is double:
- lead an exploratory approach and distinguish groups
- identify co-regulated genes which is essential in understanding many cellular process.
To identify co-regulated genes, the hierarchical clustering is the commonly used method.
The clustering consists of 3 steps:
- Selection of genes
- Clustering of arrays
- Clustering of genes
The two-ways clustering (tree of arrays and tree of genes), generated with TrAP, can be displayed with VAMP (Visualization and Analysis of CGH arrays, transcriptome and other Molecular Profiles).Vamp allows for example to select a subtree and to zoom in it.
Biclustering algorithms will be implemented soon. This will allow the identification of gene groups that show similar activity patterns under a specific subset of the experimental conditions.
The objective of differential analysis is to identify the genes whose expression differs between two predefined sample groups.
The improved detection procedure: Significance Analysis of Microarrays (SAM) was first implemented (see Tusher & al.(2001), for more details).
Other methods (such ANOVA models or non-parametric methods) are being tested and will soon be integrated to TrAP.
The result of a differential analysis, launched in TrAP, is a list of genes which are stimulated or repressed under a condition compared to an other. This list (with additional information such gene names, gene symbol, unigene id, genbank accession number, gene ontoloy annotations) can be exported in excel format.
The typical question facing researchers is: what are the functions of the significant differentially expressed genes?
TrAP allows users to assess which functions a list of genes may represent.
The analysis is based on the Gene Ontology (GO) project: this project provides a controlled vocabulary (ontology) to describe gene and gene product attributes in any organism (see www.geneontology.org, for more details).
The three organizing principles of GO are molecular function, biological process and cellular component with, for each, associated GO terms.
In TrAP, a hypergeometric test is used to determine which GO terms (from a list of genes) are significant. In addition, the distribution of significant GO terms by molecular function, biological process and cellular component was given to users.