To compare the two FrAGL profiles obtained in the previous step for each datasets proceed as follows:
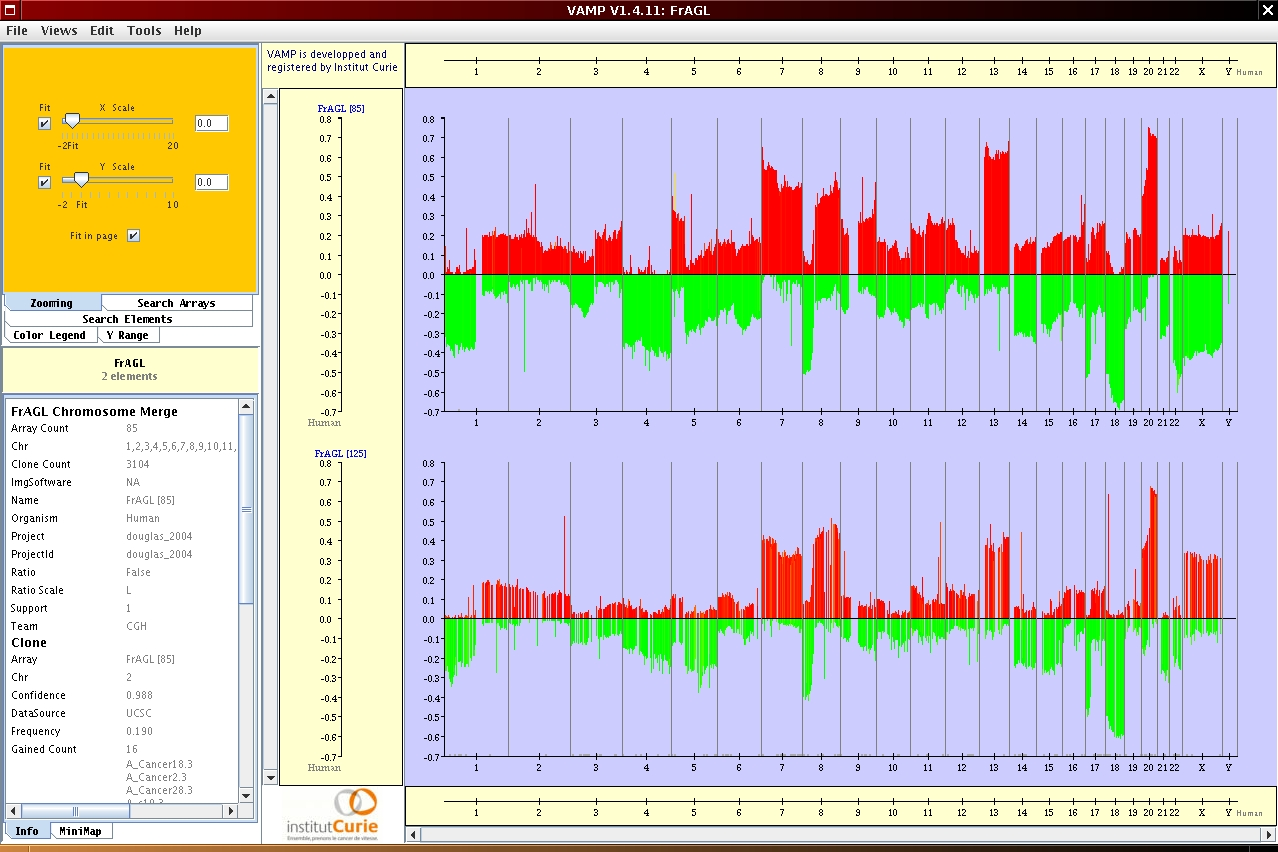
The comparison in now possible in the final view as shown in Figure 5.7.
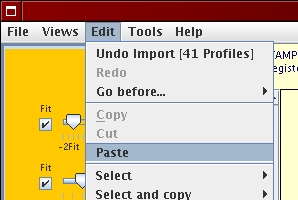
 [Edit menu - Paste]
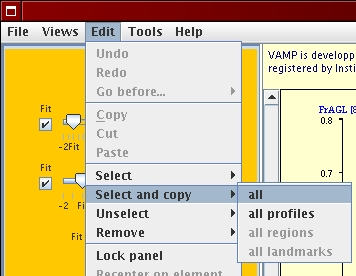