First, start the VAMP software (La Rosa et al., 2006) from the web-page:
http://bioinfo.curie.fr/actudb/access.php.
Then, load the array CGH profiles as follows:
Repeat the previous steps for the stransky_2006 directory and for the veltman_2003 directory; in the veltman_2003 directory do not select the eight first normal array CGH profiles.
n.b.: if you wish to import data from one specific chromosome (choose Chromosome 6) select All arrays in the CGH ARRAYS/blaveri_2005/Chromosomes/chr06 directory (see Figure 4.1(c)).
|
[File menu - Import] 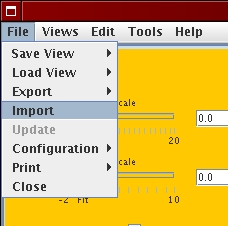 [Genome wide profile import]
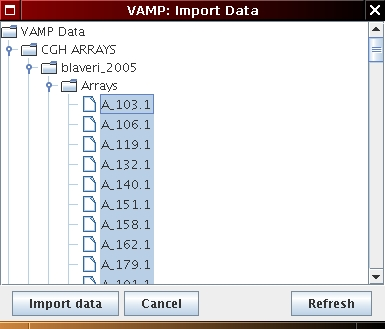 [Chromosome profile import]
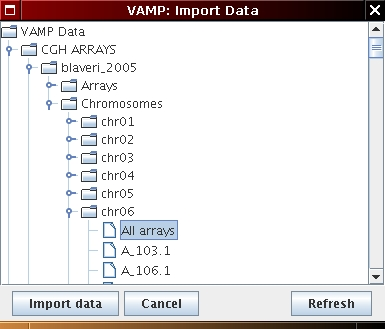
|
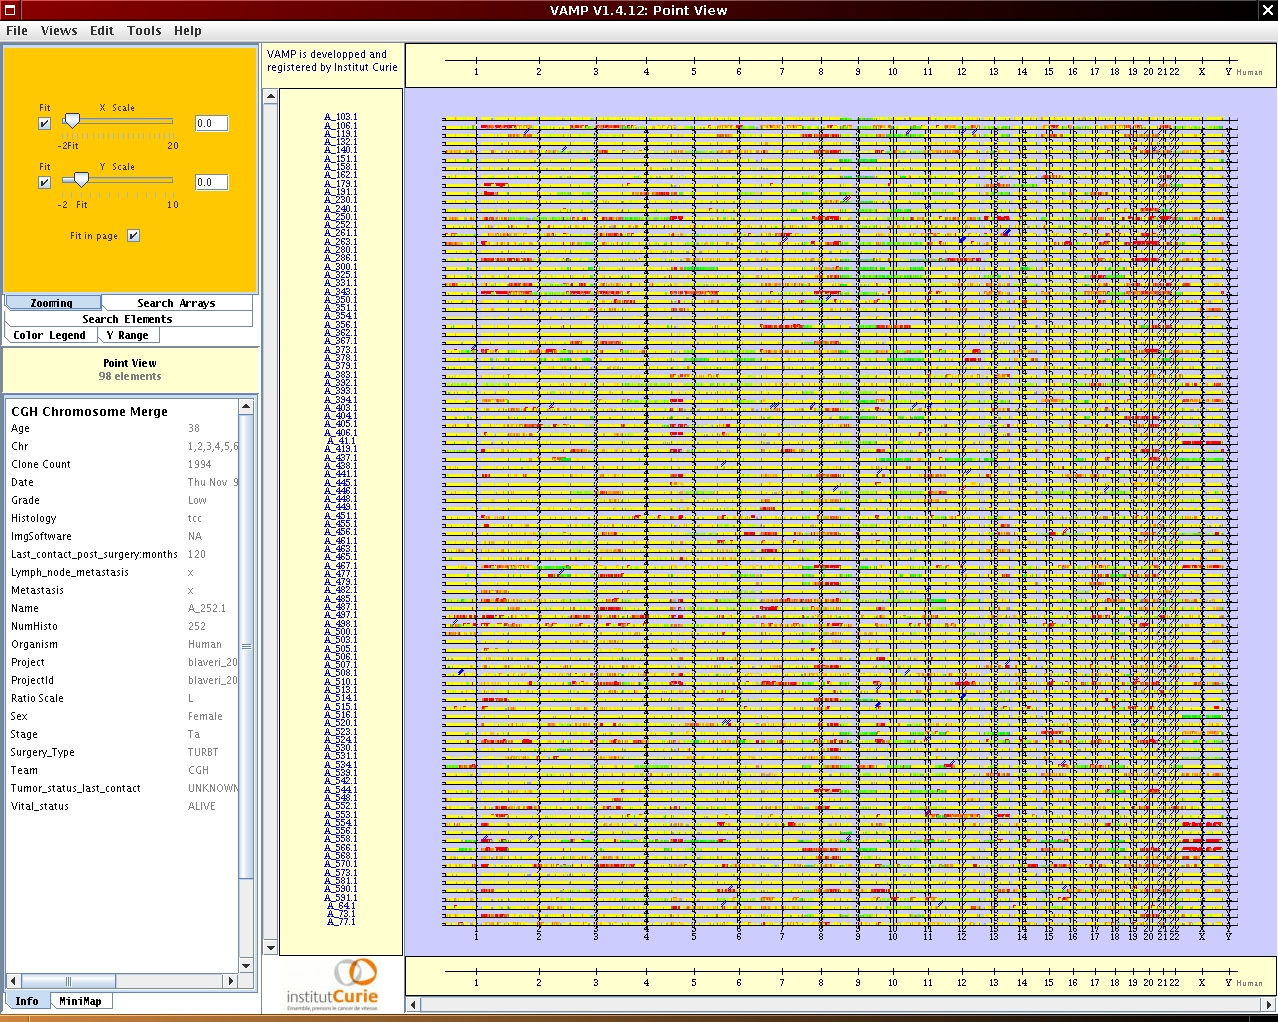
The genomic profiles are displayed in the interface as shown in Figure 4.2.
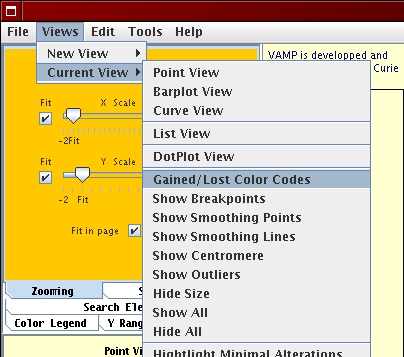
Once all the data have been imported you can display the Gained / Lost Color Codes (see Figure 4.3) which corresponds to the alteration calling identified by the GLAD algorithm (Hupé et al., 2004): loss regions are in green, normal regions in yellow, gain regions in red and amplified regions in blue.