VAMP can be run on public sets of data at http://bioinfo.curie.fr/vamp 
The VAMP software is available upon request, the license is free for academic users with research purposes. Please contact: vamp@curie.fr
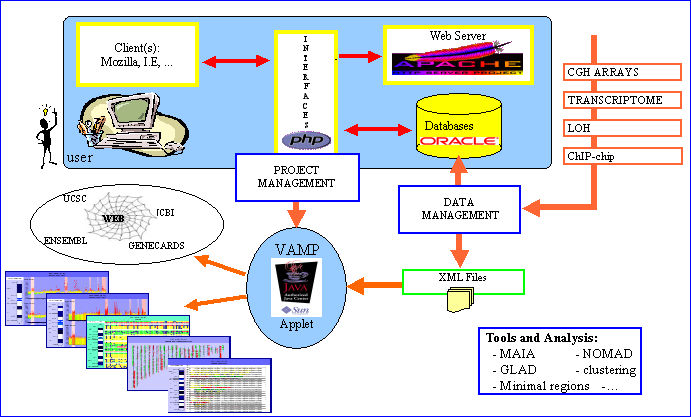
VAMP has been primarily developed for visualization and analysis of tumor sample array-CGH profiles.It consists of a graphical interface written in Java 1.4.2, and a suite of PHP and Perl scripts. Several types of visualization (like classical CGH karyotype views, array-CGH profile views, dotplots) are available which provide the user with the possibility of easily comparing different arrays simultaneously.
Additional information concerning each clone or DNA region can be retrieved interactively from different public databases throug external links. The combined display of array CGH profiles and microarray expression profiles, Loss of Heterosigosity assays or ChIP chip data is offered. Many other functionalities are also proposed like clustering, synteny visualization or identification of regions with recurrent alterations. VAMP implements a plug-in mechanism for easy integration of new functionnalities. The software retrieves information either from an Oracle database server or from XML files,and is straightforward to install.
|
 |
Data visualisation
VAMP currently offers several types of views for several species (human, mouse, yeast) : List View, Genomic View, Chromosome View, Karyotype View, Dot Plot View. All these views allows simultaneous visualization of several profiles (the only limitation is the memory size of the computer running VAMP).
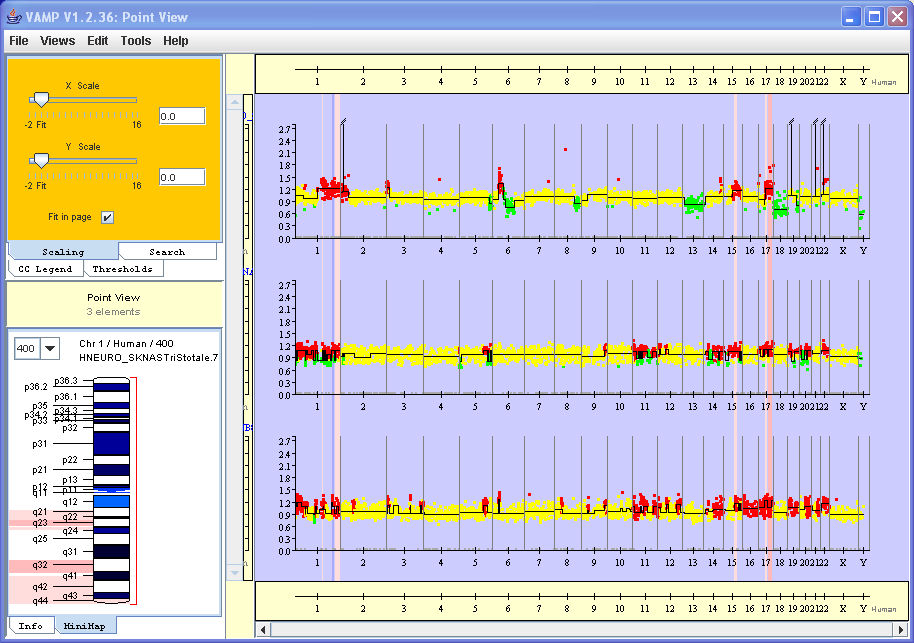
Genomic View : 
The Genomic View simply depicts the profiles along a concatenation of all the chromosomes. It is the most usual representation that allows comparison of profiles from different samples or comparison of different types of profiles from a given sample.
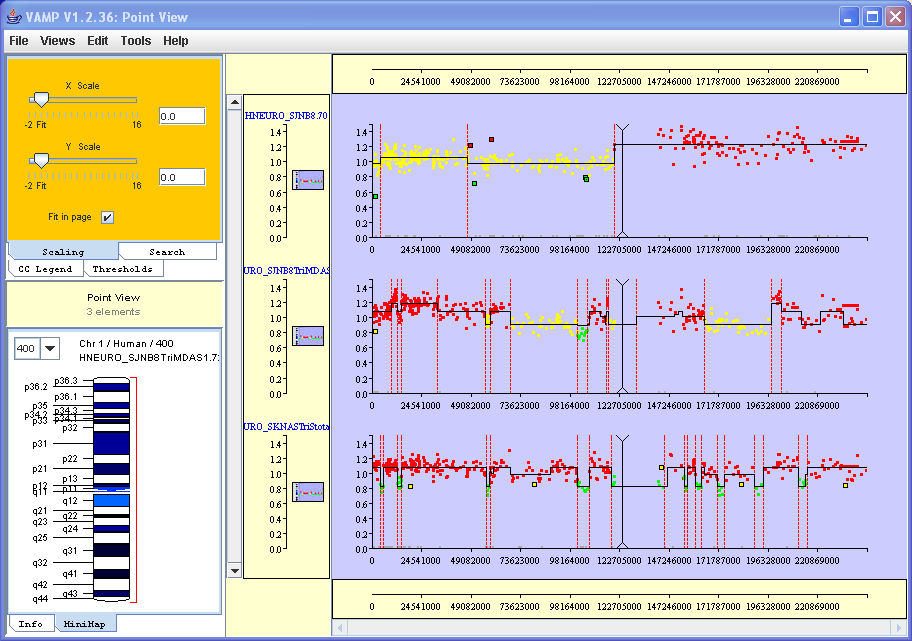
Chromosome View : 
The Chromosome View is similar to the Genomic View except that it only displays one particular chromosome. It is also possible to merge several but not all chromosomes on a view.
The Genomic and Chromosome Views can display the profiles as spots, histograms or curves. They may also contain a reference profile which would appear on a separate frame above the main view and can be used as a reference when browsing a collection of profiles.
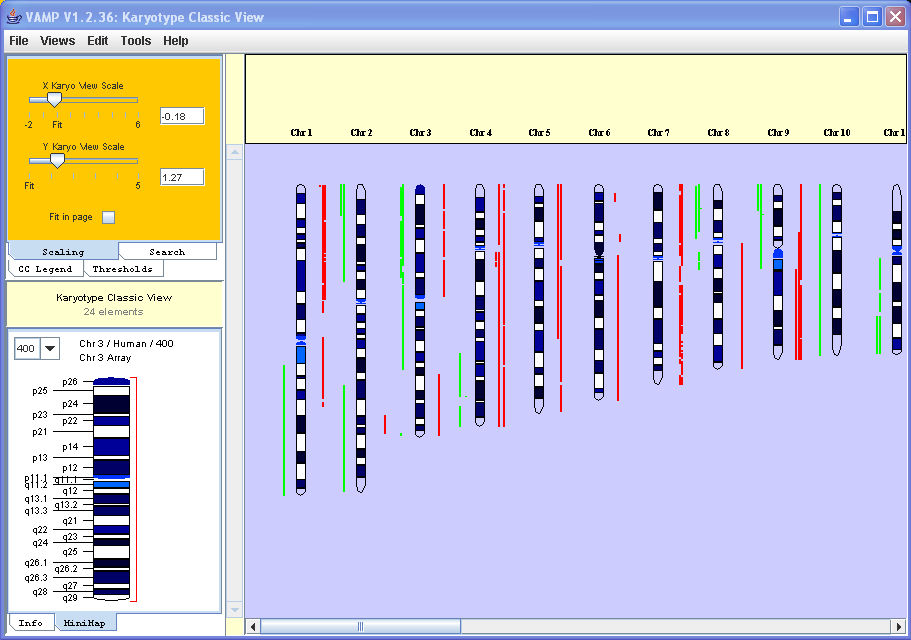
Karyotype View : 
The Karyotype View displays profiles with the usual rendering of classical CGH: vertical drawing of chromosomes with banding and contiguous representation of sample profiles.
Dot Plot View : 
The Dot Plot View does not consider clone / probe position onto the genome, but only their ranks. It displays a collection of samples as a heat map based on the level of signal for each clone / probe.
List View :
The List View appears automatically when loading a data file. It consists in the list of names of all the arrays and is useful for doing a selection or keeping track of the data under study.
By default spots or histograms are colored according to the signal intensity (generally using ratios of the two channels or log-ratios) using a continuous scale from red to yellow to green. For all the aforementioned views applied to CGH data, it is possible to color them as a function of array-CGH data analysis results. By default DNA regions analysed as gained will be displayed in plain red, lost in plain green, and normal in plain yellow.
We refer the user to the manual (under construction) for a full description of VAMP functionalities.
VAMP can be run on public sets of data at http://bioinfo.curie.fr/vamp.
The following array-CGH data are currently browsable : Snijders et al. (2005), Gysin et al. (2005), Douglas et al. (2004), de Lee
uw et al. (2004), Veltman et al. (2003), Pollack et al. (CGH and transcriptome array data, 2002), Snijders et al. (2001) and Naka
o et al. (2004).
The VAMP software is available upon request, the license is free for academic users with research purposes. Please contact: vamp@curie.fr